Do Southern Rockies conifer forests store more carbon after fires?
Our recent manuscript of “Postfire recovery of western US forest carbon stocks (1984-2017) (In review)” finds that rapidly recovering Southern Rockies conifer forests will potentially store more carbon than the pre-fire state.
Introduction
Forest fires account for approximately 35% of global fire emissions and can shift forest ecosystems from carbon sinks to carbon sources. In recent decades, wildfires across western US forests have increased both in size and frequency (Iglesias et al., 2022). Between 2010 and 2019, on average, 43,456 fires were reported annually in western ecosystems.
Fires release carbon stored in plants through three different pathways: combusting biomass during the fire itself; killing vegetation that slowly decomposes over time; and altering trajectories of forest regrowth.
On short time scales, fires drastically reduce forest C stocks (via combustion and tree mortality) while on longer time scales, postfire vegetation recruitment and regrowth restore carbon in aboveground biomass (AGB) and soil. However, fires can take a variety of postfire recovery pathways depending on the rates of vegetation mortality, recruitment and regrowth.
We analyzed 694 fires from the “Monitoring Trends in Burn Severity” (MTBS) between 1984 to 2017 covering three National Ecological Observatory Network (NEON) ecodomains in the western US, namely, Pacific northwest (PNW), Northern Rockies (NR), and the Southern Rockies (SR) (Figure 1) to answer;
- How does the forest structure (i.e., canopy height) recovery rate vary across ecoregions?
- To what extent do climatic conditions and fire characteristics (e.g., fire size and fire severity) explain postfire recovery in each ecoregion?
- To what extent did wildfires in the western US change growing stock volume (GSV) over a 34-year record?
Our goal is to understand the effects of wildfires on the recovery of aboveground vegetation and carbon stock in the western US conifer forests.
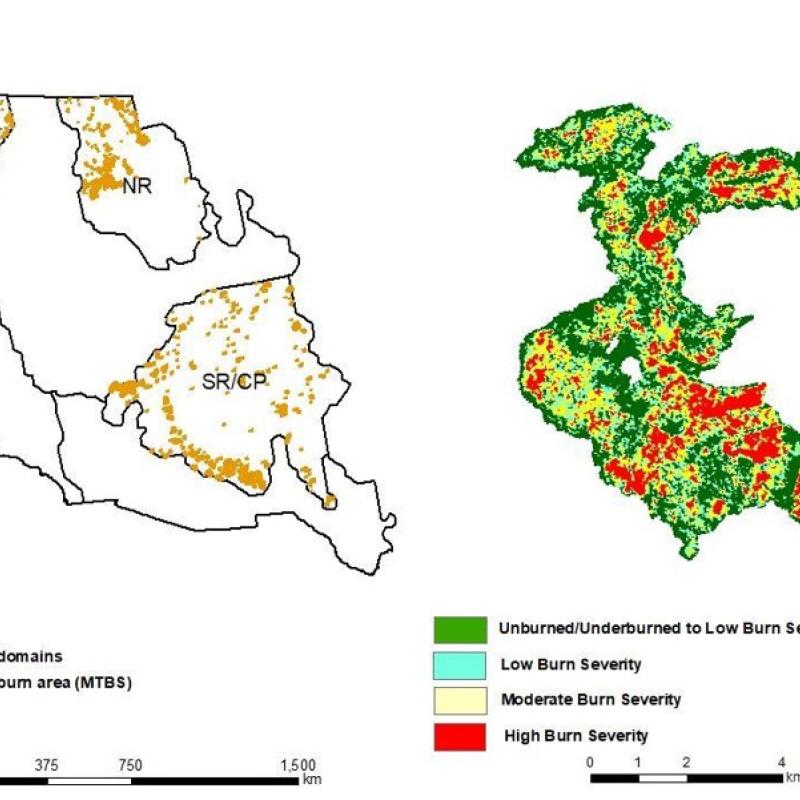
Figure 1: a) Forest burns according to Monitoring Trends in Burn Severity (MTBS; 1984- 2017). b) MTBS burn severity within the Little Beaver Complex fire (2010).
What we did
We extracted Global Ecosystems Dynamic Investigation (GEDI) estimated vegetation height and cover metrics representing all burn severity categories (i.e., unburned, low, moderate, and high). In this study, canopy height represents the mean vegetation growth while the cover indicates the photosynthetic area and canopy openness of the forest. We used same GEDI metrics extracted from unburned background forests from each fire to calculate percent change of canopy height, which we used as the postfire recovery metric. Then, we fitted three non-linear models to build postfire recovery trajectory for three chronosequence, PNW, NR, and SR using percent canopy height change and the time since fire. To explore the effects of fire size, topography, climate, and fire severity on postfire vegetation recovery, we applied Generalized Additive Models (GAMs). We assessed the relative influence of those fire and climate variables on percent canopy height change using a forward stepwise selection process.
What we found
Western US ecoregions take between 9-25 years to initialize the gain of canopy height. Canopy height shows an initial decrease followed by an increase with time since fire. The magnitude of the increase or decrease varied with respect to fire severity and ecoregion (Figure 2). The largest decline in canopy height is depicted in areas with high burn severity in all three ecoregions (23 % - 52.5%), while the lowest decline is resulted from the low burn severity areas (1.3% - 6.2%). Northern Rockies forests show both the largest decline and the smallest decline in canopy height.
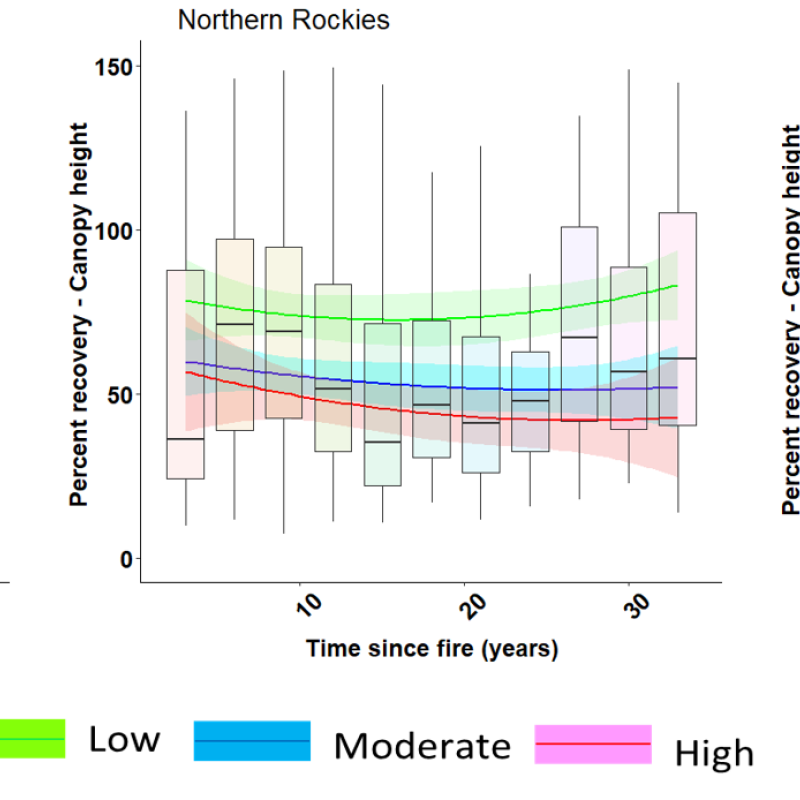
Figure 2: Postfire canopy height recovery trajectories with burn severity in a) PNW, b) NR, and c) SR. Green: Low severity, blue: Moderate severity, red: high severity. The shaded areas around solid lines represent the 95% confidence interval.
Time since fire controls 50% - 60% of the vegetation recovery. In addition, we observe ecoregion specific vegetation recovery controls; Pacific Northwest: distance to undisturbed region, Northern Rockies: Fire size, and Southern Rockies: drought occurrence.
The SR region gains 14% of growing stock volume (GSV) while both the NR (-32%) and PNW (-7%) show a loss of canopy volume compared to their respective unburned backgrounds after 34 years of the fire. Low burn severity regions in the SR region gain the most GSV (28%). The largest difference in GSV, however, is observed with high severity fires (-52%) in the NR ecoregion compared to unburned backgrounds (Figure 3).
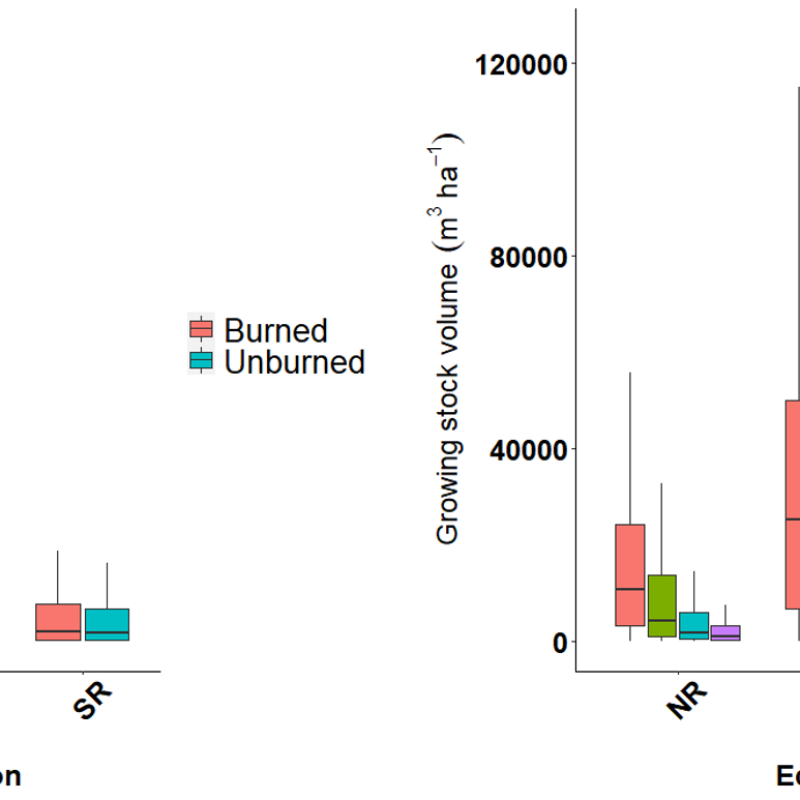
Figure 3: Per pixel canopy volume across three ecoregions using 34 years of fire records a) Overall canopy volume regardless of fire year and severity. b) Canopy volume across burn severity gradient. 0 to 4 represents burn severities of 0 - Unburned, 2 - Low Burn Severity, 3 - Moderate Burn Severity, 4 - High Burn Severity
Take home points
- Post-fire vegetation recovery rates in the western US are ecoregion specific, with the fastest recovery in the Southern Rockies and the slowest recovery in the Pacific Northwest forests.
- The recovery rates are mainly controlled by time since fire. In addition, the Pacific Northwest forests are sensitive to the distance to undisturbed regions emphasizing the accessibility to seed sources. The Northern Rockies postfire forest recovery trajectory was influenced by fire size.
- The Southern Rockies forests postfire recovery is greatly influenced by drought occurrence.
- If fire return intervals become shorter than 50 years, both the NR and PNW will have significantly reduced carbon stocks while the rapidly recovering forests in the SR will potentially store more carbon than the pre-fire state.