Fast and Efficient Forest Inventory Using UAS Data
Josephina Matibag writes a blog about her summer research into creating a Fast and Efficient Forest Inventory Using UAS Data
Forest inventory involves collecting and analyzing forest-related data, such as tree height, age, species, and health, to inform forest management, planning, and policy that maximizes forest productivity. However, this process is challenging because data collection is very complex: continuous monitoring is necessary for effective decision-making, and thorough assessments are both time- and resource-intensive.
In ecological research, the use of unmanned aircraft systems/vehicles (UAS/UAVS; also known as drones) has become increasingly popular for its ability to collect very high-resolution data with a variety of sensors at relatively low cost and low effort. (Villarreal et al., 2025) Traditional forest ecology survey methods have included ground-based surveys and satellite-based remote sensing. UAS offers the unique opportunity to fill in the gaps between these two methods by linking these spatial and temporal scales that are on two extreme sides of the spectrum. (Spiers et al., 2023) There is also the added benefit of reduced invasiveness, absence of hazards, and enhanced reliability that characterizes UAS ecological research. (Sharma et al., 2025)
For this project, we flew Mavic 3E UAS, which collects Red-Green-Blue (RGB) imagery with 85% lateral and cross-track overlap, ensuring every part of the transect flown is captured once the imagery is pieced together. (Fig. 1) The sample fire location used is the High Meadows burned scar. The drone is flown at about 100 m above ground level (AGL). To be consistent with the AGL across the terrain, we used a 30 m digital elevation model (DEM) from the area of interest to inform the drone’s flight. On average, each flight takes about 20 minutes to complete, covering 4-5 ha, capturing thousands of images. After the collection stage, the UAS data is processed through the Agisoft Metashape software, which uses advanced photogrammetry tools to output various models: orthomosaic (Fig. 2), digital surface model (DSM) (Fig. 3), and a 3D point cloud (Fig. 4). UAS captured imagery is capable of providing spectral and structural data as high as 3 cm resolution, the equivalent scale of individual plants. (Villarreal et al., 2025)

Fig. 1 Individual pictures captured on the drone (image on the left) are collected with 85% lateral and cross-track overlap, so they can be pieced together in one final image of the whole transect (image on the right).

Fig. 2 Orthomosaic (~ 3 cm resolution) derived from images collected from UAS data at High Meadows burned scar.
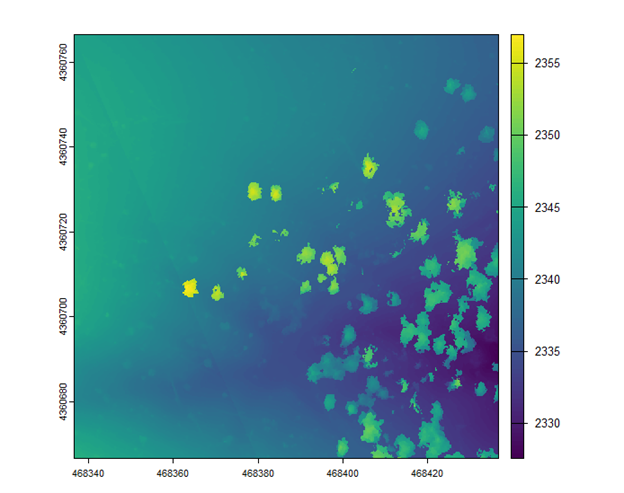
Fig. 3 Digital Surface Model (DSM) derived from 2D images collected using the UAS system. The color represents the surface heights, where blue is the lowest and red is the highest in meters.

Fig. 4 Dense point cloud data derived from 2D images collected using the UAS system. The color represents the heights, where blue is the lowest and red is the highest in meters.
These models are used in the post-processing stage to extract specific data such as tree location, height, and crown area. In R programming, we get the terrain/elevation model (DTM/DEM) (Fig. 5) and canopy height model (CHM) (Fig. 6) from the point cloud data using the LidR package. The DEM provides information about the elevation of the bare-ground topographic surface of the indicated transect. The ground elevation variability is from ~2330 m to 2345 m mean sea level (MSL). The CHM provides information about the height of the trees and their spatial variability. CHM variability is between 0 m to ~20 m. The spatial variability is not explicitly defined; however, the model shows the trees are fairly spaced out from one another. The canopy height models are then used to detect the tree locations using the “locate_trees” function in the lidR R package (Fig. 7). The “lmf” algorithm delineates tree crown areas for each detected tree (Fig. 8) (Roussel et al., 2020).

Fig 5 Digital Terrain Model

Fig. 6 Canopy Height Model

Fig. 7 Tree Locations

Fig. 8 Tree Crown Area
The potential of high-resolution UAS data is expansive and adaptable to a variety of ecological areas of study. These preliminary data sets provide a plethora of options for future research to build upon. A few ideas could include: approximate biomass of individual trees to the total biomass of an area, spatial distribution of biomass/carbon before and after disturbance, disturbance impacts analysis, post-disturbance soil erosion analysis at the microscale, and much more. By providing reliable, easily repetitive, and low-cost remote sensing methods, UAS data is advancing ecological research in a way that will improve ecosystem health monitoring and management success assessments.
Acknowledgements
This research was supported by the National Science Foundation under a CAREER grant (NSF CAREER) and by the NASF CAST. Special thanks to Nayani T. Ilangakoon for her mentorship and contributions to this project.
References
Sharma, S., Dixit, A. K., Saxena, S., & Kaur, G. (2024). A study into the application of ecological drones for wildlife conservation. Lecture Notes in Networks and Systems, 1025, 193–203. https://doi.org/10.1007/978-981-97-3594-5_16
Spiers, A. I., Scholl, V. M., McGlinchy, J., Balch, J., & Cattau, M. E. (2025). A review of UAS-based estimation of forest traits and characteristics in landscape ecology. Landscape Ecology, 40(2), 29. https://doi.org/10.1007/s10980-024-01991-0
Villarreal, M. L., Bishop, T. B., Sankey, T. Ts., Smith, W. K., Burgess, M. A., Caughlin, T. T., Gillan, J. K., Havrilla, C. A., Huang, T., LeBeau, R. L., Norton, C. L., Sankey, J. B., Scholl, V. M., von Nonn, J., & Yao, E. H. (2025). Applications of unoccupied aerial systems (UAS) in Landscape Ecology: A review of recent research, challenges and emerging opportunities. Landscape Ecology, 40(2), 43. https://doi.org/10.1007/s10980-024-02040-6