How Much Water Makes A Flood?
Exploring the Relationship Between Stream Discharge, Gage Height, and Flood Extent
A RIMORPHIS initiative conducted by Avra Saslow & Kristen Tortorelli with help from Elsa Culler and Dr. Toby Minear.
Introduction to River Morphology
River flooding is a complex and multi-dimensional issue that affects residential, urban, commercial, and rural communities throughout the country. Rivers are not stagnant systems; rather, they are dynamic networks that contract, swell, and shift. Flooding rivers have extensive damage capabilities, as the volume of water overflow, the velocity of flow, and the rate of rising water all increase rapidly and immensely. When this happens, not only does water expand beyond the banks (the land surrounding either side of a river), but the actual geometries of river channels can change. River morphology, or the shape and direction of channels, is quite malleable over time as erosion, deposition, and the movement of sediment occur during flood events.
Modelling river flooding requires several parameters to extract insights, including surface topography, water volume, water area, and point and line topologies. (See image below.) This project aims to develop a tool to extract river characteristics during flood events. Specifically, we'll focus on the intersection between two parameters: water area, and water volume.
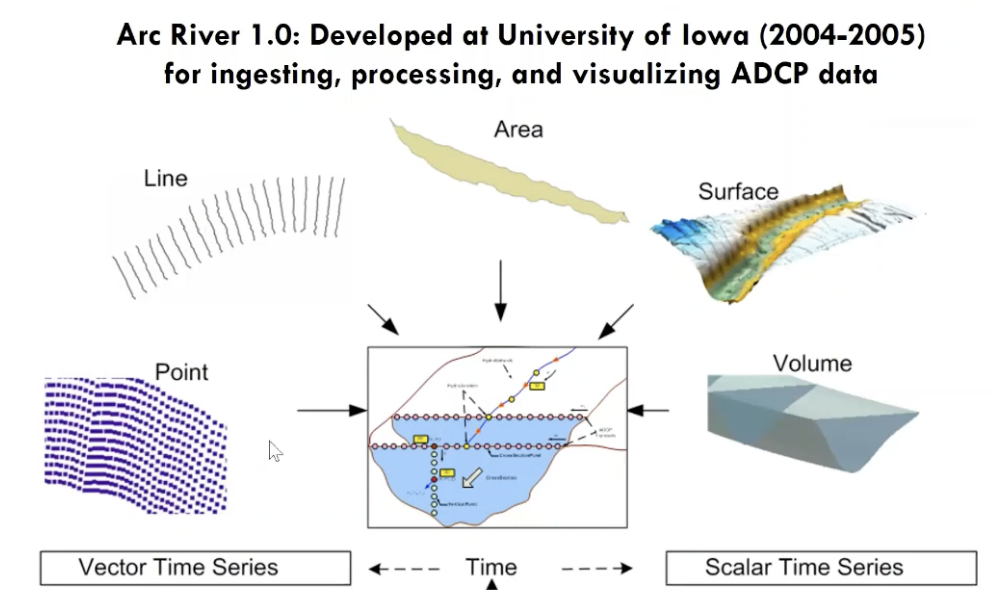
By comparing water volume and water area, we can determine if there's a correlation between the two, which opens up the door more for possible predictions. This kind of tool can aid in contextualizing floods with real-time observations and data, as opposed to just historical events.
Why does it matter?
Major flood events impact a vast number of communities through the United States every year, and as climate change continues to destabilize river ecosystems and patterns, the increasing damages resulting from river flooding must be dealt with. The more information we have regarding flood events and their surface-area extent as a function of water volume data, the better chances we have at eventually developing a tool to predict and plan for extreme flood events by using readily available sources of data. Since rivers are such dynamic systems, it is crucial to model flooding extent and severity so that we can predict and mitigate damage to surrounding areas. We can see the immediate effects of floods on infrastructure when hundred-year floods arrive and destroy roads and buildings.
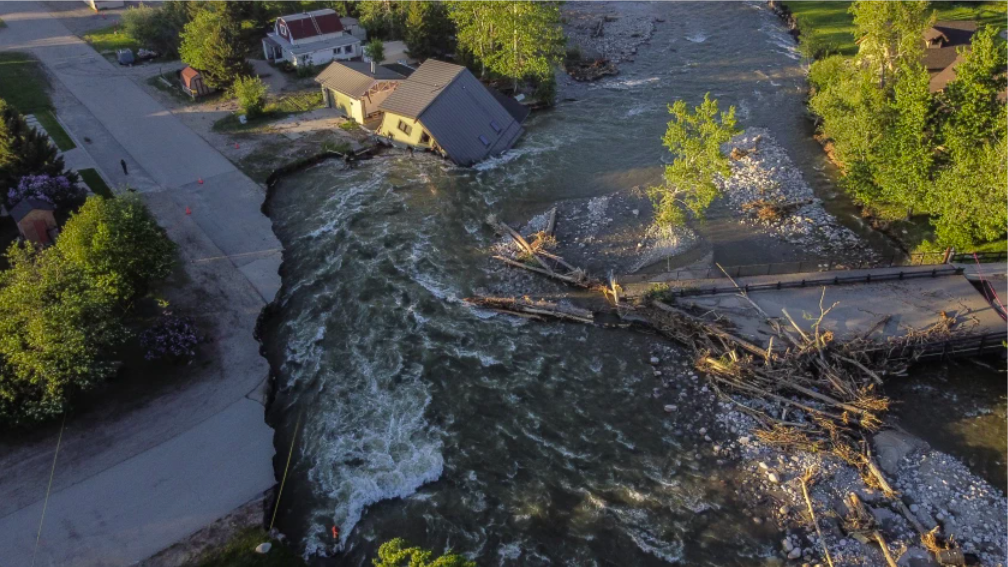
For example, in June 2022, Montana and Idaho and Washington all experienced extraordinary floods due to a very wet spring. In particular, Red Lodge Montana experienced a 500-year flood that damaged several houses and vehicle bridges. (See image below.)
Modelling flooding and understanding where the water goes can help us make informed decisions about how we build our infrastructure. Should we spend the extra time and money to build bridges that can withstand the next 500-year flood? Or should we rebuild a bridge within the new geometry of the channel and accept the risk that it will be broken again in the next historic flood?
Lastly, this kind of tool can help members in the infrastructure industry have more accurate and reliable data and insight on which to base design standards off of. This data analysis can be used to validate and verify (or invalidate) long-established infrastructure design standards that are primarily based on theory, rather than actual data. More accurate and reliable design standards lead to more flood-resilient infrastructure and planning, which in turn helps to mitigate the devastating damages that can occur from major flood events.
Flood Data Collection Background
Water area is a unit that can be obtained through aerial imagery provided by satellites. The images captured by satellites are obtained under the same in principle as any other camera-based image you might be familiar with: they're made up of pixels. By extracting bodies of water from satellite images, we can count the number of water pixels found per image, which gives us a sense of how much surface area the water occupies. We utilized the Sentinel-2.&text=Sources%2FUsage%3A%20Public%20Domain.) satellite system, which takes multispectral images every ten days.
Water volume can be assessed with a multitude of methods. The United States Geological Survey (USGS) maintains more than 10,000 water gages throughout the U.S that measure water levels continuously. All of the gages measure by at least one standard: gage height, which is the height of the water level from the bottom of a streambed, or stream discharge, which is the rate at which a volume of water passes by. The USGS provides both measurements for some sites, or only one for others.
We tested using both measurements as an indicator of water volume to understand which one provides a better picture of river flooding. The question is, does gage height or stream discharge have a higher correlation with water area? This can influence which metric is better for flood prediction modelling.
Findings
When comparing stream gage data against flooding surface-area extent, we ultimately found that the stream discharge metric appeared to show a stronger correlation to flooding extent than stream gage height data (see plots below). These plots display water pixel count, representative of flood water surface area, on the y axis, and river gage data, representing water volume, on the x axis.
We would expect to see little to no increase in water pixel count (or surface area covered by water) at lower discharge or gage height values. When the river is at typical day-to-day levels, there should not be water overflowing the banks. However, at a certain trigger discharge or gage height value when flooding begins to occur, we would expect that the water pixel count values would begin to rapidly increase as water begins to overflow the banks and cover greater surface area.
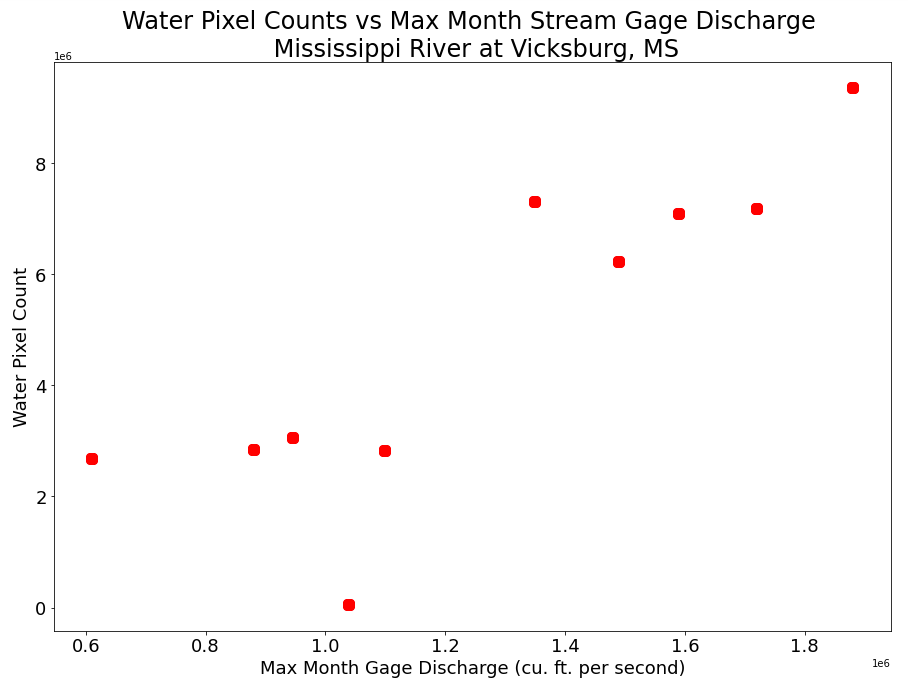
Plot above shows water pixel count versus stream gage discharge data in cubic feet per second for the Vicksburg, Mississippi monitoring site on the Mississippi River. This data spans the year of 2019. Each data point represents the intersection between maximum month discharge and water pixel count for a compiled monthly image generated from Sentinel 2 data. Some data points were omitted from each site's plot due to inaccurate water pixel counts as a result of cloud coverage interference. For each site, some months experienced very cloudy weather, which blocked remote sensing data from capturing water area. In order to preserve the accuracy of the correlations shown, we omitted those data points from our analysis.
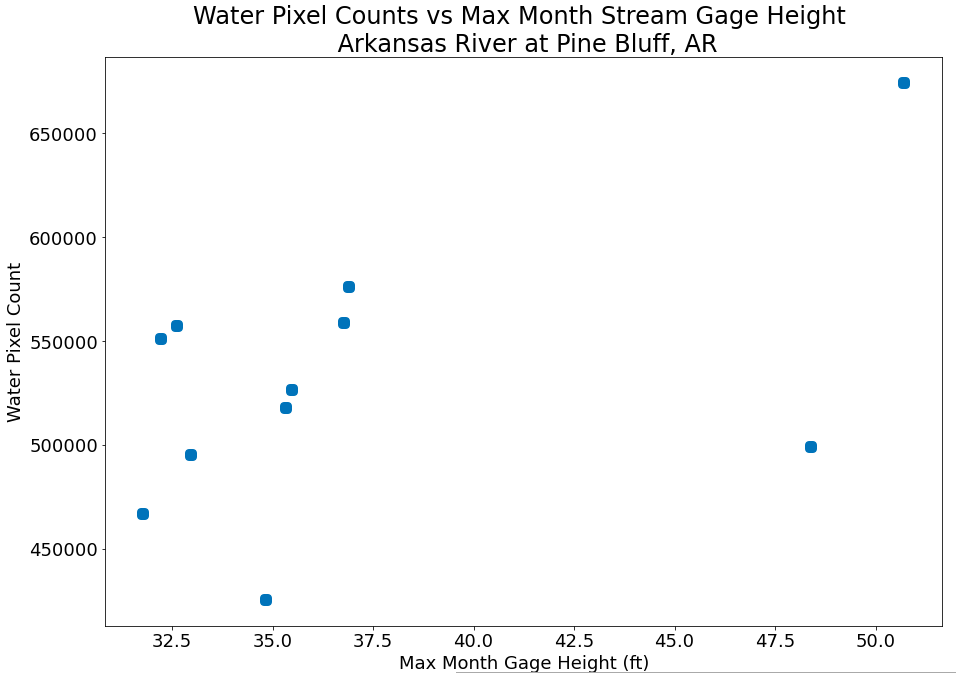
Plot above shows water pixel count versus stream gage height data in feet for the Pine Bluff, Arkansas monitoring site on the Arkansas River. This data spans the year of 2019.
As shown in the plots above, it would appear that the expected correlation described above between water pixel count and gage data is stronger for the Vicksburg, Mississipi site than for the Pine Bluff, Arkansas site. This may indicate that river gage discharge data has a stronger correlation to flood extent than gage height. There may be several reasons for this, as elaborated on further in the discussion section of this report. However, it is important to note that several more analyses of this type should be performed to validate this finding and mathematically define the relationship between water pixel count and gage data.
Methodology
There was a two-part analysis required for this project:
- Analyze areiel imagery for water pixel count using the Sentinel-2 satellite
- Analyze USGS stream gage data for maximum monthly values
In order to begin either of the analyses, the first step was choosing ideal sites to analyze, and making sure it met the following criteria:
- Experienced a significant flood event within recent years
- Has available gage height data and/or stream discharge data
We eventually found two sites that fullfilled these criteria: Vicksburg, Mississipi and Pine Bluff, Arkansas. Both had flood events in 2019, and they differed in providing gage height and stream discharge data.
The methodology from there was as follows:
- Obtain the natural satellite imagery for each month of 2019 for each site
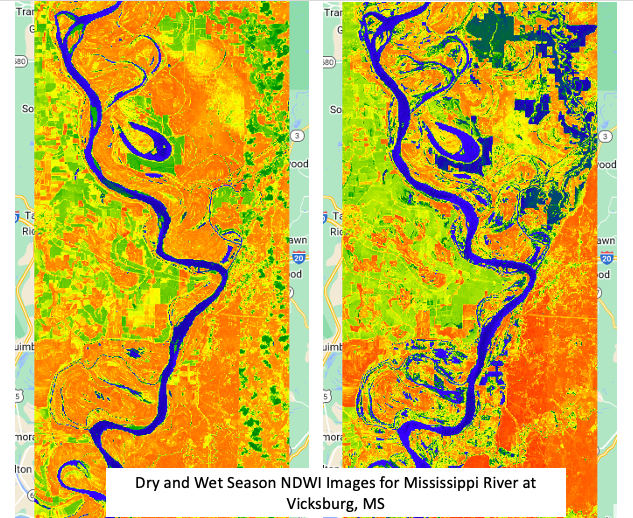
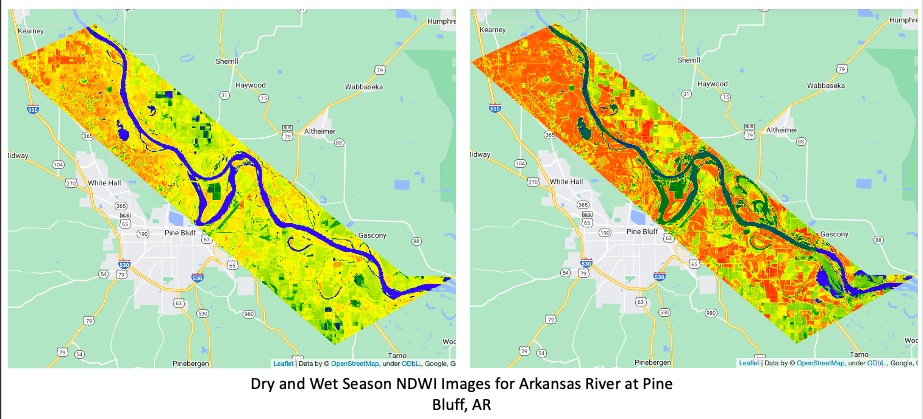
- Generate a Normalized Difference Water Index (NDWI) image that uses green and near-infrared bands from satellite images to display areas of water seperate from the surrounding soil and vegetation. These images can show changes from dry season to wet season, and how channels change over time.
See images below for wet and dry season NDWI images for both sites.
Satellite methodology continued:
After obtaining NDWI images for each site during typical and flooding conditions, we performed the following steps:
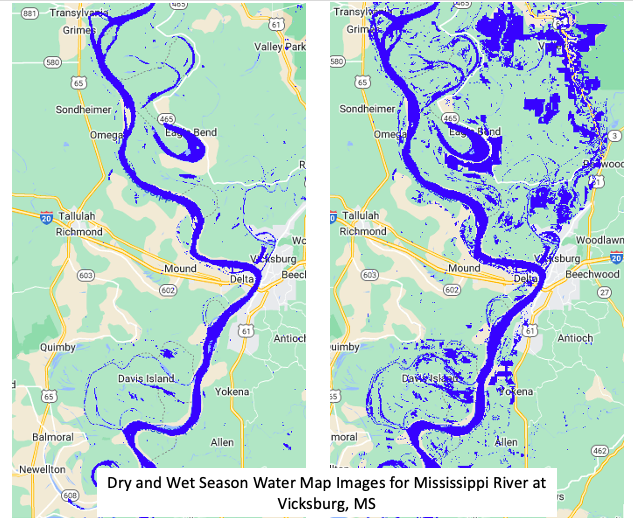
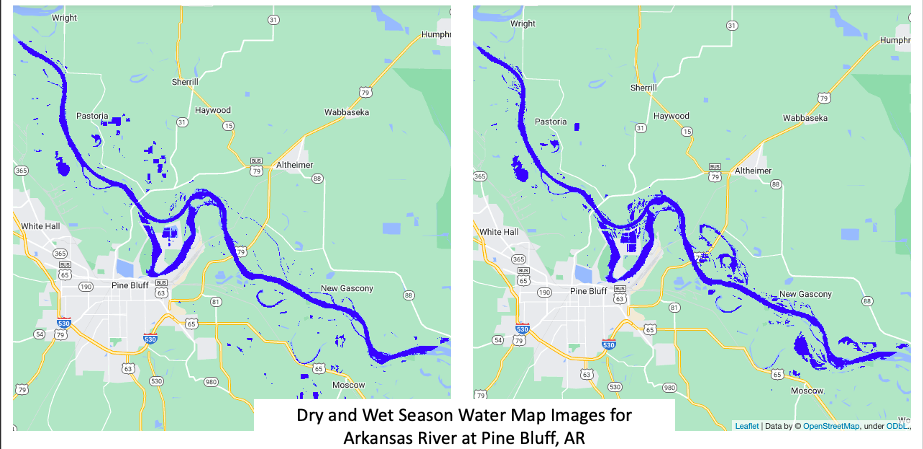
- Extract water pixels from each NDWI image to generate water pixel maps (see images below)
- Count the number of water pixels in each image, which provides an indication of the amount of surface area covered by water before, during, and after major flood events
Stream gage methodology:
The methodology concerning stream gage data can be done concurrently with the satellite analysis, and was as follows:
- Obtain stream gage discharge (cubic feet per second) for Vicksburg, Mississippi
- Obtain gage height (feet) for Pine Bluff, Arkanasas
- Extract maximum monthly values in 2019 for each site
The intersection of stream gage and satellite analyses:
The final component to the workflow was plotting the stream gage data for each site against the monthly water pixel count values to generate the plots at the beginning of this report.
Discussion and Implications
Throughout the course of this project, we came up with the following conclusions:
- Our proof of concept was established for using this methodology to investigate the relationship between water area and water volume during flood events.
- There appears to be a visual correlation between flood extent and discharge that may be stronger than the relationship between flood extent and gage height. This theory should be validated with further analyses at various sites and flood events.
- There are specific boundary conditions likely required for each location, due to the river shape and surrounding water bodies around the river.
- This kind of analysis may benefit from active remote sensing data with radar capabilities (such as Sentinel 1 data) to circumvent errors brought about by heavy cloud coverage
Intuitively, these findings make sense: stream discharge represents a volumetric measure of water in the river channel, whereas gage height represents only one dimension of the river water. Therefore, discharge may be more closely correlated with flood extent than the gage height at any given point in the river. The implications of this project and its findings means there is a relationship between water volume and water area, and thus, this research can be extended to build flood predictions ranging from where water might go when a certain threshold of volume is surpassed to how river channels might migrate when inundated with floods.
By the time satellite images from Sentinel-2 are collected (approximately every 10 days), it could be too late in a flood's timeline and the flood extent could have massive damages. At the same time, just gathering stream gage data, while it is collected continuously and readily available every day, isn't enough to tell us where is most susceptible to damage. By isolating the relationship between the two, we can use the continuous stream gage data to predict flood extents and be better equipped to mitigate flood hazards. Engineers, designers, and planners can all use this information to ensure that their design standards for nearby infrastructure appropriately address potential flood events.
Where to Find Out More
Please visit our GitHub repository to see all notebooks, reports, presentations, and documentation related to our project.
Link to GitHub repository: https://github.com/AvraSaslow/ea-rimorphis
Sources
Brown, Matthew, and Lindsay Whitehurst. “Gateway Towns to Yellowstone Park Become Dead Ends after Flood.” Los Angeles Times, Los Angeles Times, 16 June 2022, https://www.latimes.com/world-nation/story/2022-06-16/yellowstone-floodwaters-threaten-water-supplies-montana.
Stream Gage Data
The stream gage data for all three sites was obtained from the U.S. Geological Survey (USGS) website:
Pine Bluff, AR Site: U.S. Geological Survey, 2016, National Water Information System data available on the World Wide Web (USGS Water Data for the Nation), accessed April 27, 2022, at URL [https://waterdata.usgs.gov/nwis/dv?cb_00065=on&format=gif_default&site_no=07263650&referred_module=sw&period=&begin_date=2019-01-02&end_date=2020-01-01].
Vicksburg, MS Site: U.S. Geological Survey, 2016, National Water Information System data available on the World Wide Web (USGS Water Data for the Nation), accessed April 27, 2022, at URL [https://waterdata.usgs.gov/nwis/uv?site_no=07289000].
Sentinel-2 Data
Sentinel-2 (ESA) images courtesy of the U.S. Geological Survey
'Copernicus Sentinel data 2019, 2021' for Sentinel data;