Biodiversity across scales: Mapping functional diversity with remote sensing to assess scale dependencies in biodiversity monitoring
Summer Graduate Research Assistant, Meghan Hayden, discusses biodiversity across scales
This work was a collaboration between Meghan Hayden (GRA, Earth Lab), Matthew Rossi (Earth Lab), Cibele Amaral (Earth Lab), Jacob Nesslage (UC Merced), Madeline Slimp (UC Santa Cruz), Rachel Meyer (UC Santa Cruz), Laura Dee (CU Boulder) & Natasha Stavros (Ball Aerospace) and was funded by the US National Aeronautics and Space Administration (NASA) Biodiversity Survey of the Cape (BioScape).
Biodiversity loss is accelerating globally, with losses to plant diversity being driven by habitat fragmentation, climate change and altered disturbance regimes (Figure 1). Increasingly, efforts to understand biodiversity change over space and time are being prioritized to promote ecosystem health and resilience (e.g., Intergovernmental Science-Policy Platform on Biodiversity and Ecosystem Services (IPBES); Díaz et al. 2015).
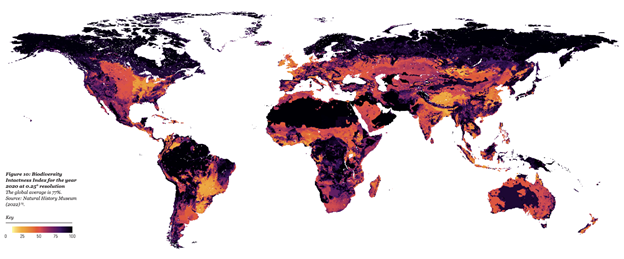
Figure 1: Biological communities are fundamentally changing due to human pressures. Across the globe, biodiversity intactness (i.e., how much of an area’s native biodiversity remains) varies dramatically, with many areas facing lowered resilience (<90% intactness) and some facing risk of collapse (<30% intactness). Source: Natural History Museum, 2022.
Investigating impacts of global change on biodiversity is essential for preserving ecosystem resilience but is often limited by the spatial and temporal constraints of traditional in-situ data (Figure 2). Biotic and abiotic filtering take place at different scales, which shapes the diversity we observe, with implications for monitoring and conserving diversity and ecosystem functioning. As a result, it’s not clear what scale is best for monitoring.
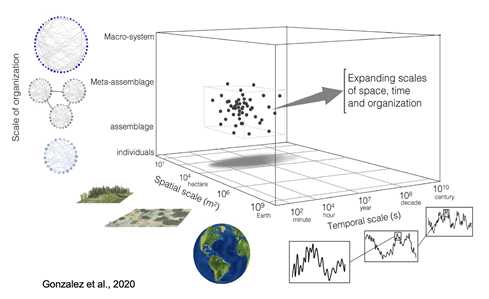
Figure 2: Studies investigating biodiversity change and impacts to ecosystem functioning have historically been limited in their organizational, spatial and temporal scales. Yet, expanding the scales of observation is important for monitoring biodiversity in the face of global change Source: Gonzalez et al., 2020.
Advances in remote sensing address this challenge, in part, by enabling continuous mapping of biodiversity at large spatial scales (Figure 3).
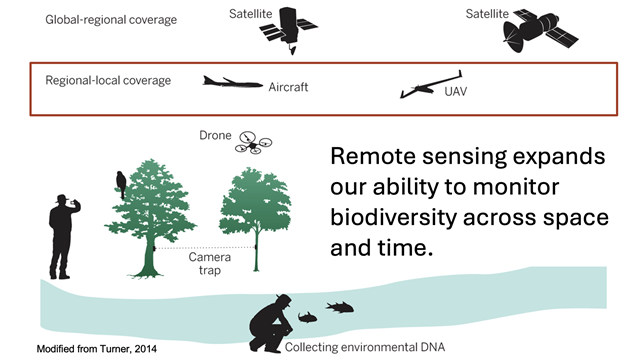
Figure 3: Advances in remote sensing allow data capture at large spatial and temporal scales. Importantly, spatial patterns in reflectance are continuous, allowing assessment of landscape patterns without gaps in data acquisition. Source: Modified from Turner, 2014.
In particular, imaging spectroscopy (or, hyperspectral imagery) can detect functional and compositional characteristics of vegetation by measuring subtle differences in reflected light in narrow and contiguous bands of light. The information produced by imaging spectroscopy is particularly useful to ecology, as the way in which a surface reflects light (its “reflectance signature”; Figure 4) indicates something about the properties of that surface. Plants absorb electromagnetic radiation in the visible wavelengths (400–700 nm) according to their pigmentation and photosynthetic activity. Chemical compounds and structural attributes of plants modulate the amount of radiation absorbed in longer wavelengths (Ustin and Jaquemood, 2020). Thus, the level of light reflected (vs. absorbed or transmitted) in various portions of the electromagnetic spectrum can reveal leaf and canopy surface properties, including tissue chemistry, anatomical structure and morphological attributes (i.e., functional traits; Cavender-Bares et al., 2020). Variation in reflectance across a plot or a landscape is hypothesized to represent diversity in functional traits, phenology, and perhaps species (i.e., the spectral variance hypothesis; Palmer, 2000).
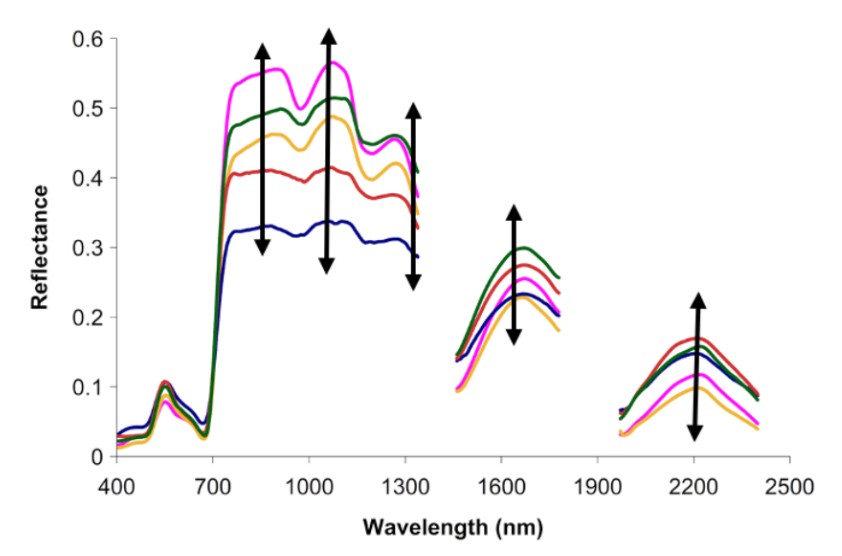
Figure 4: The reflectance of a pixel across wavelengths, or its “reflectance signature” (here, colored lines), indicates something about the functional traits of plants in the pixel area. Further, we can look at variation (indicated by black arrows) in reflectance among pixels in a community as a proxy for species or functional diversity.
Yet the scale-dependence of spectral diversity metrics, and how they vary as a function of environmental setting need to be addressed in order to leverage remote sensing data for large-scale assessment of biodiversity (Figure 5).
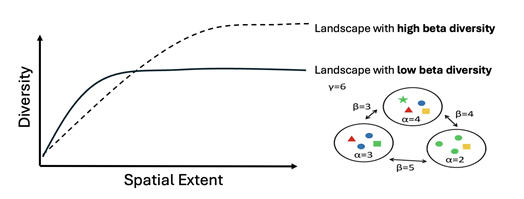
Figure 5: We expect remotely sensed diversity to vary with scale, but we don’t yet understand how the environmental context might influence this dependency. For example, we might expect landscapes with different levels of beta diversity to show different scaling relationships. Rarefaction theory suggests that diversity will reach higher magnitudes in landscapes that are highly heterogeneous or have a high level of beta-diversity (𝜷 = turn-over in diversity among communities, where 𝜶 = local diversity and 𝜸 = regional diversity).
To this end, we ask three main questions:
- How does spatial scale influence remotely sensed metrics of functional diversity?
- Is there a scale at which these metrics stabilize?
- Where different scaling relationships occur, can differences in scaling be explained by other environmental variables like climate, topography, and ecosystem type?
To address these questions, we compute functional diversity using data from the imaging spectrometer aboard the National Ecological Observatory Network Airborne Operating Platform (NEON AOP), which measures reflectance in the VSWIR (400 - 2500 nm). We analyze images from five sites across the United States (>100 individual scenes) that span grassland, forest, and desert ecosystems (Figure 6).
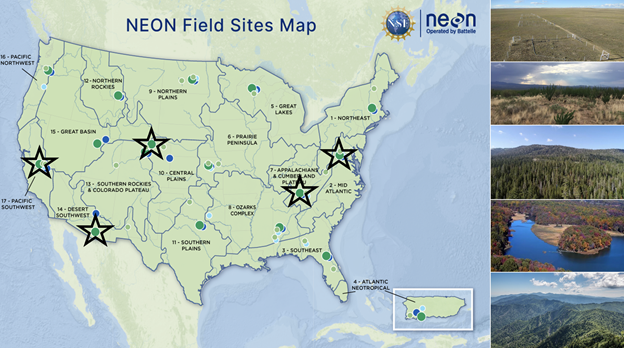
Figure 6: We assess diversity across 5 ecosystems using NEON data. These include grassland (Konza Prairie Biological Station; KNZ), desert shrubland (Santa Rita Experimental Range; SRER), mixed coniferous and deciduous forests (Lower Teakettle; TEAK and Talladega National Forest; TALL), and mixed (Smithsonian Environmental Research Center; SERC) land cover classes. All data comes from May - September 2019. Source: Modified from NEON.
We consider three complementary metrics of functional diversity that capture the distribution and abundance of functional types/traits in a community niche space (as in Schneider et al., 2017) (Figure 7):
- Functional Richness: A measure of the niche extent, describing the outer boundary of the functional space occupied by pixels in a community. We use the convex hull volume of pixels mapped in principal component space to represent richness in this study.
- Functional Evenness: A measure of the evenness of abundance distributions among pixels in the community niche space. We use the variation in the segment length of the minimum spanning tree among all pixels in the principal component space to represent evenness in this study.
- Functional Divergence: A measure of the distribution or spread of pixels within the community niche space. We use the mean distance of all pixels to the center of gravity of the principal component space to represent divergence in this study.
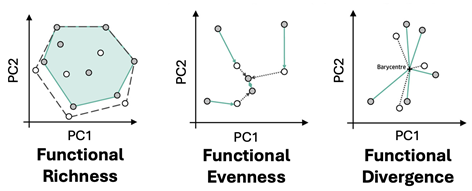
Figure 7: Functional richness, evenness and divergence are computed with dimensionality reduced reflectance. We expect functional richness to increase with area as more unique values are accumulated, but the relationship between evenness/divergence and area is less clear.
Iterating through neighborhoods of 225-m2 to 0.5-km2, we explore the relationship between functional diversity and neighborhood size across scenes (Figure 8). We use BRDF and topographical correction to account for sensor angle and slope effects on reflectance and additionally mask out any non-vegetated pixels via a radiometric threshold.
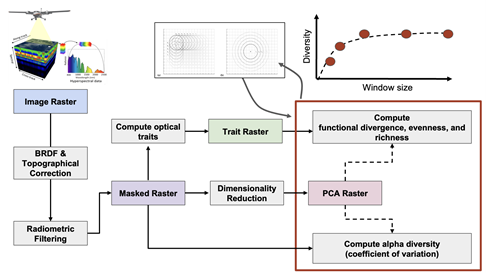
Figure 8: Our workflow for assessing scale dependencies in functional diversity includes pre-processing of data (correction and filtering) and dimensionality reduction prior to computation of functional richness, divergence and evenness. We iterate through these steps for neighborhood sizes varying from 15 x 15 m2 to 400 x 400 m2, using a moving window approach to extract average values per neighborhood size across a scene. This workflow and associated code will ultimately be published as a Python package as a product of this GRA.
We calculate the amplitude, slope, and length of the scaling relationship (Figure 9) for each scene and then regress these values against a number of environmental covariates in order to explore how the environment influences scale dependencies.
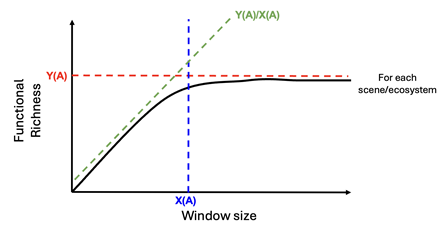
Figure 9: Scaling relationships are characterized by the slope Y(A)/X(A), amplitude/asymptote Y(A) and length of relationship, or e-folding value X(A). We compute these metrics for each scene in order to assess scale variance by environmental context.
Overall, we confirm scale dependencies in functional diversity (Figure 10). Across sites, functional richness increases logarithmically with area and stabilizes towards a more uniform value at scales on the order of hundreds of square meters.
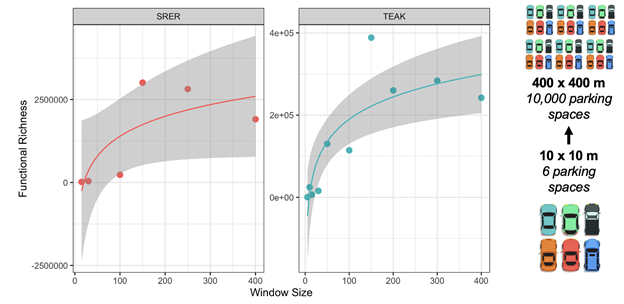
Figure 10: Functional richness increased with area (window size, x by x meters) at two sites (SRER and TEAK), but stabilized at areas on the order of a couple hundred meters in magnitude, indicating non-linear scaling relationships. Sites reached different magnitudes of richness and at different scales. In this study, the smallest neighborhood area assessed would fit 6 mid-sized vehicles, whereas the largest area would fit over 10,000 vehicles.
Our next steps include regressing metrics of these scaling relationships against environmental covariates (e.g., elevation, slope, beta diversity and productivity) available through the NEON data in order to understand what drives variation in scaling. By mapping and understanding functional diversity as a function of spatial scale, our approach provides a new set of tools to better constrain relationships between biodiversity and ecosystem functioning, identify drivers of biodiversity loss, and connect conservation actions to global biodiversity targets. In addition to producing research that furthers understanding of scale dependencies in remote sensing of biodiversity, we are also working on a Python package that will allow for mapping of normalized diversity metrics using hyper- and multispectral data. Stay tuned for updates!

References:
Cavender-Bares, J., Gamon, J., & Townsend, P. (2020). Remote Sensing of Plant Biodiversity. Springer.
Díaz, S., Demissew, S., Carabias, J., Joly, C., Lonsdale, M., Ash, N., ... & Zlatanova, D. (2015). The IPBES Conceptual Framework—connecting nature and people. Current Opinion in Environmental Sustainability, 14: 1-16.
Gonzalez, A., Germain, R.M., Srivastava, D.S., Filotas, E., Dee, L.E., Gravel, D., Thompson, P.L., Isbell, F., Wang, S., Kéfi, S., Montoya, J., Zelnik, Y.R. & Loreau, M. (2020), Scaling-up biodiversity-ecosystem functioning research. Ecology Letters, 23: 757-776.
Palmer, M.W., Wohlgemuth, T., Earls, P., Arévalo, J.R. & Thompson, S. (2000) Opportunities for long-term ecological research at the tallgrass prairie preserve, Oklahoma. Cooperation in long term ecological research in central and Eastern Europe: proceedings, 123–128.
Schneider, F.D., Morsdorf, F., Schmid, B., Petchey, O.L., Hueni, A., Schimel, D.S., & Schaepman, M.E. (2017) Mapping functional diversity from remotely sensed morphological and physiological forest traits. Nature Communications, 8, 1441.
Turner, W. (2014) Sensing Biodiversity. Science, 346(6207): 301-2.
Ustin, S. L., and S. Jacquemoud (2020) “How the Optical Properties of Leaves Modify the Absorption and Scattering of Energy and Enhance Leaf Functionality.” In Remote Sensing of Plant Biodiversity, edited by J. Cavender-Bares, J. Gamon, and P. Townsend, Springer, 349-384.