Taking the Low Road
Taking the Low Road: Floodplain Connectivity in Boulder, CO
By Lindsay Chipman and Julia Sobczak
Restoring floodplain connectivity encourages water to flow into side channels and ponds, which ultimately mitigates the impact of heavy flooding. We investigated different methods to visualize this process through aerial imagery (drones), elevation models (LiDAR), histograms, and simulations. Our results can be used to help land-use planners design and implement restoration practices in the St. Vrain watershed.
Collaborators and Acknowledgements
Lindsay Chipman, Julia Sobczak, Matthew Bitters, and The Watershed Center. This notebook constitues the final project for the University of Colorado Earth Data Analytics Professional Certificate, special thanks to the Earth Lab and Dr. Elsa Culler!
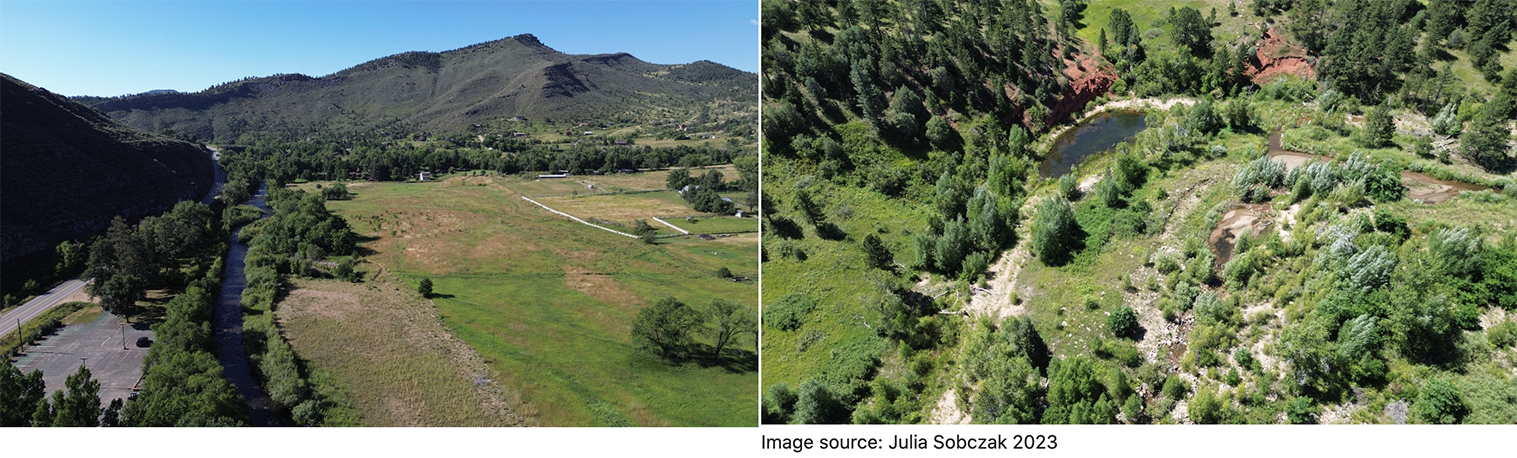
Image source: Julia Sobczak 2023
Introduction: What is a floodplain?
A floodplain is the area adjacent to a stream that becomes inundated with water when a flood occurs. This space allows the flood to spread out and release energy and suspended objects such as sediment, logs, and debris. By reducing the flow of water down the stream corridor, floodplains effectively mitigate destruction to buildings and other infrastructure downstream (FISRWG 1998).
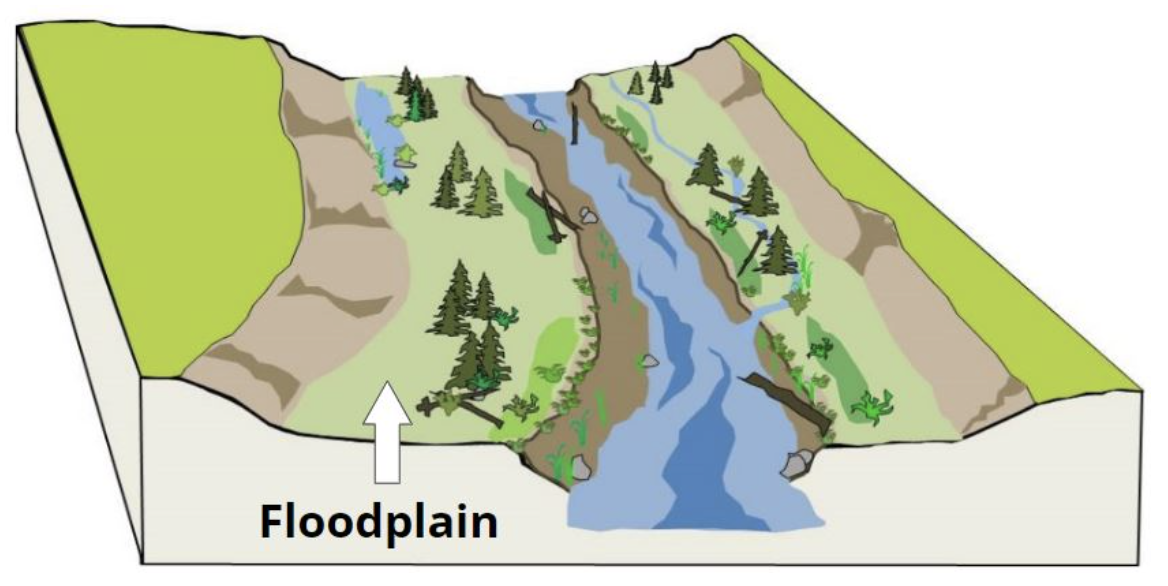
Image Source: American Rivers 2016
BUT this can only happen if the floodplain is "available" to the stream, i.e., if the area around the stream is low enough to be inundated when floodwaters occur. If a floodplain is situated above the highest flow of water, it will not be accessible by the stream - we call this a disconnected floodplain (American Rivers 2016).
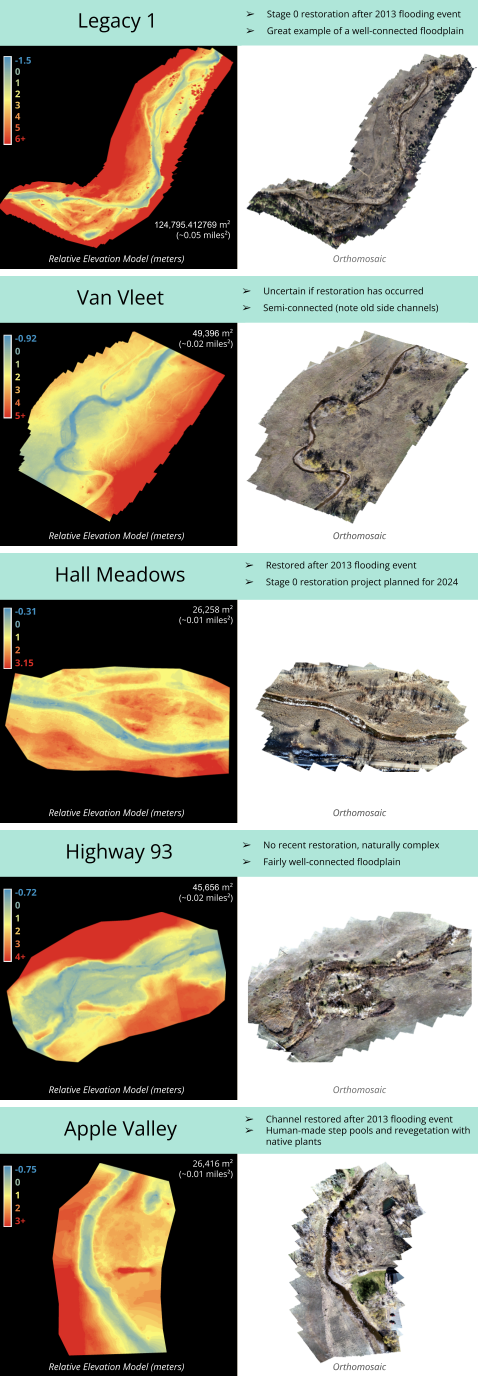
On the left is one of our study sites: Apple Valley. Notice how there is only one channel of water and the land around the stream is relatively high; this plain is inaccessible to the stream. If a large flood ran through here, the water would funnel down the "shoot" with dangerous strength and speed encouraging erosion and destruction. On the right is our Legacy 1 site where one can observe more complexity and side channels for the water to follow. If flooding occured here, the water would flow into the many side channels and ponds which reduces its speed and encourages suspended objects to "drop" onto the land instead of continuing downstream.
Methods: Using Elevation Models to Evaluate Floodplain Connectivity
Models of floodplain elevation can be used to investigate surface characteristics, estimate connectivity and complexity, and predict where water will flow. A Digital Terrain Model (DTM) is a representation of the topographic surface of the Earth excluding trees, buildings, and any other surface objects. A Relative Elevation Model (REM) is a DTM normalized to the stream channel. REMs are used to visualize fluvial landforms that may be hard to discern from an aerial image or DTM alone.
We obtained images of the study sites from drones or Unmanned Aerial Vehicles (UAVs) that the Watershed Center captured in 2022. From these UAV images, we created DTMs using the software Agisoft Metashape, which performs photogrammetric processing of digital images to generate 3D spatial data. We then created REMs from these DTMs using two methods:
- REM Generator Tool. This is a free tool available from the Colorado Water Conservation Board's Colorado Fluvial Hazard Zone Program. However, it requires an ArcGIS license to run.
- REMMaker tool available on github at RiverREM. This is an open-source python tool.
The images below are the high-resolution REMs we created from the UAV images using the 'REM Generator Tool' in ArcMap. The cooler colors represent lower elevations and reveal features such as the main channel, side channels, depressions, and pools. The hotter colors represent higher elevations and show features such as slopes, hills, and at some sites, such as Legacy 1, canyon walls.
Methods- Visualizing the UAV and LiDAR DTMs with Raster Plots and Histograms
We wanted to compare DTMs obtained from different data sources to investigate floodplain connectivity. Therefore, in addition to the drone-derived REMs shown above, we created REMs using DTMs generated from Light Detection and Ranging or LiDAR, which is a remote sensing method used to examine the surface of the Earth. LiDAR data overlaying our study sites was available on the Colorado Hazard Mapping & RiskMAP Portal.
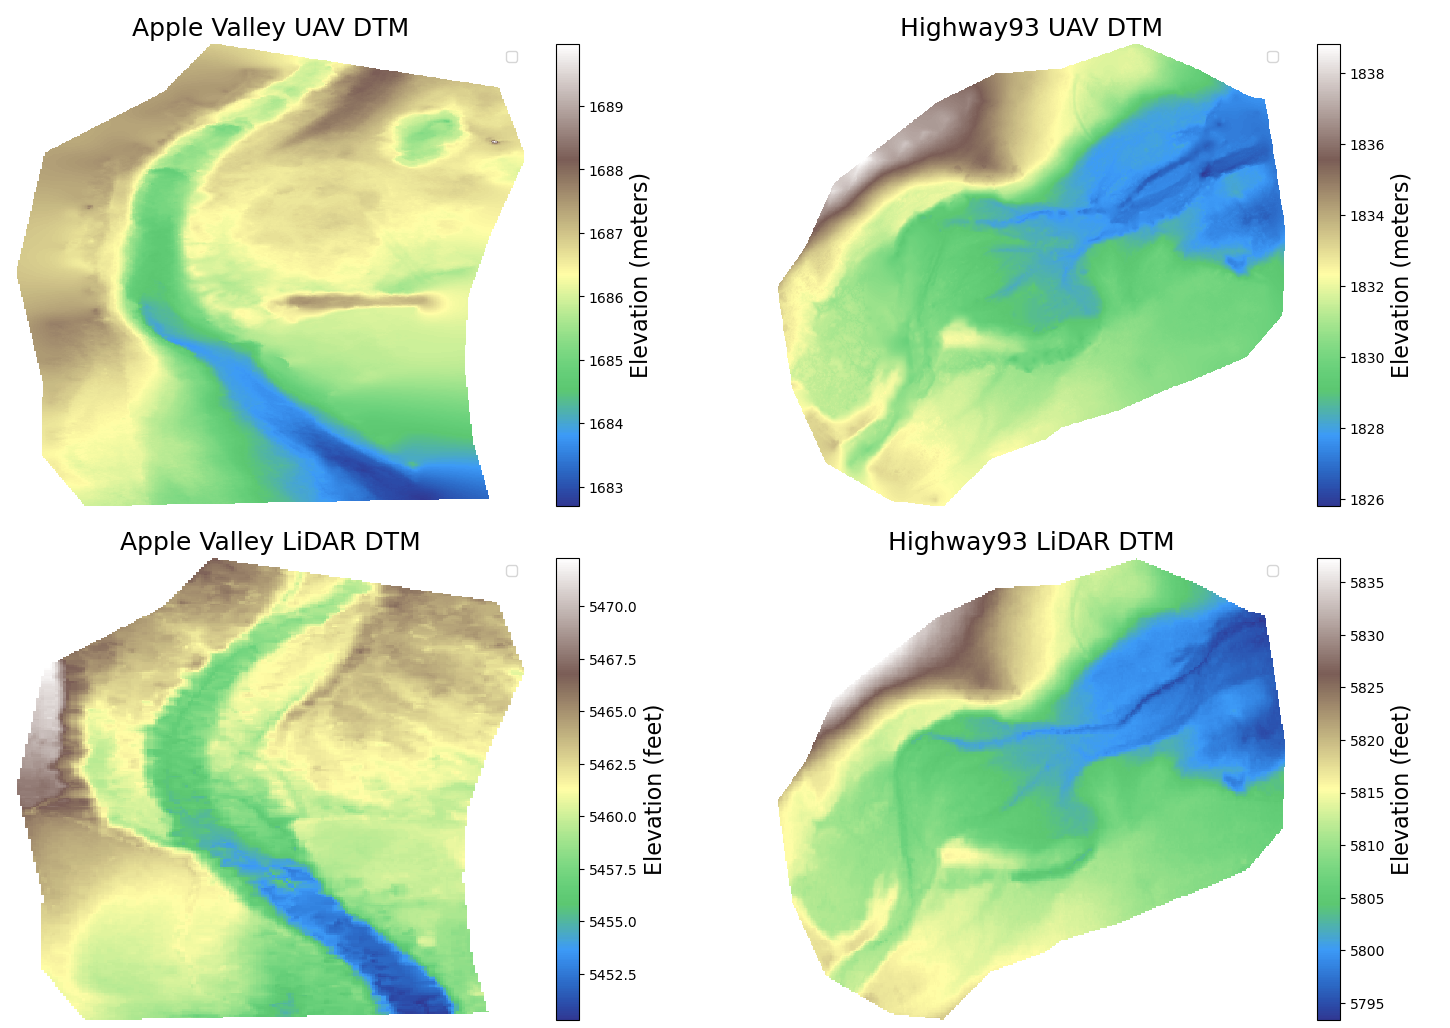
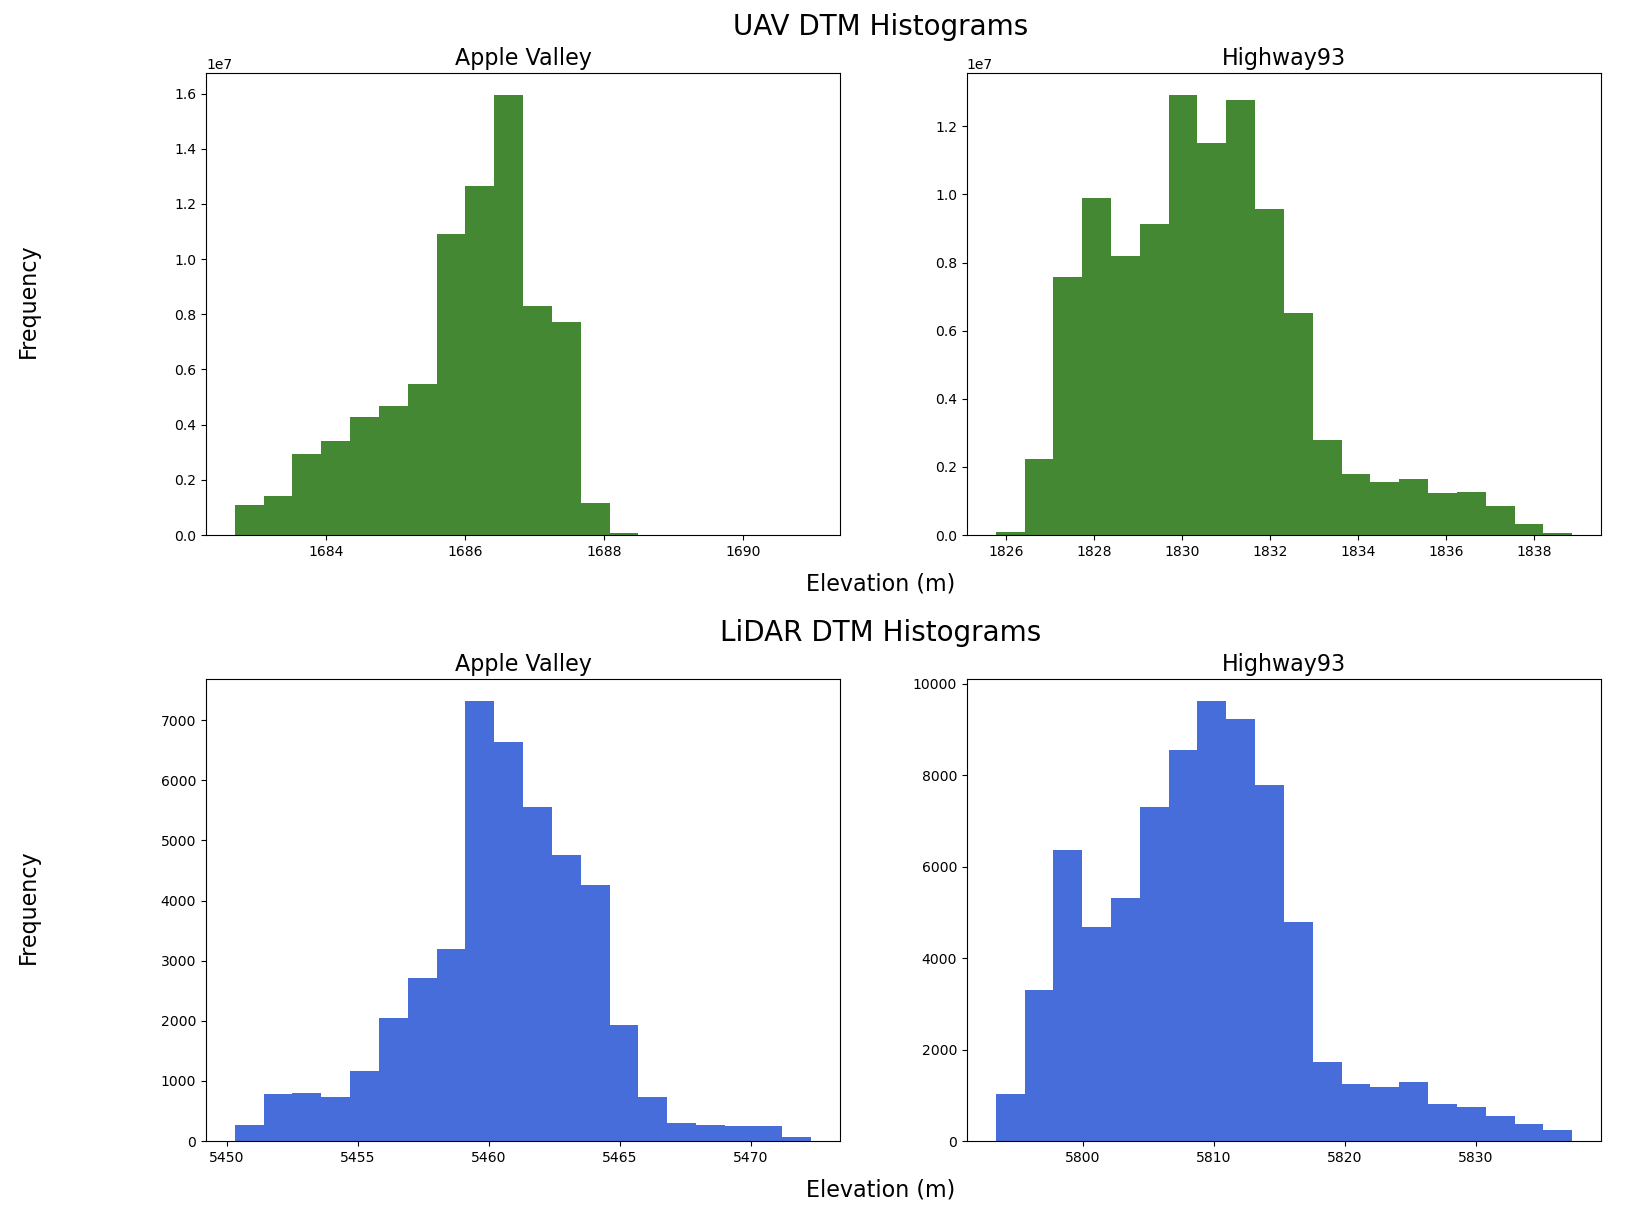
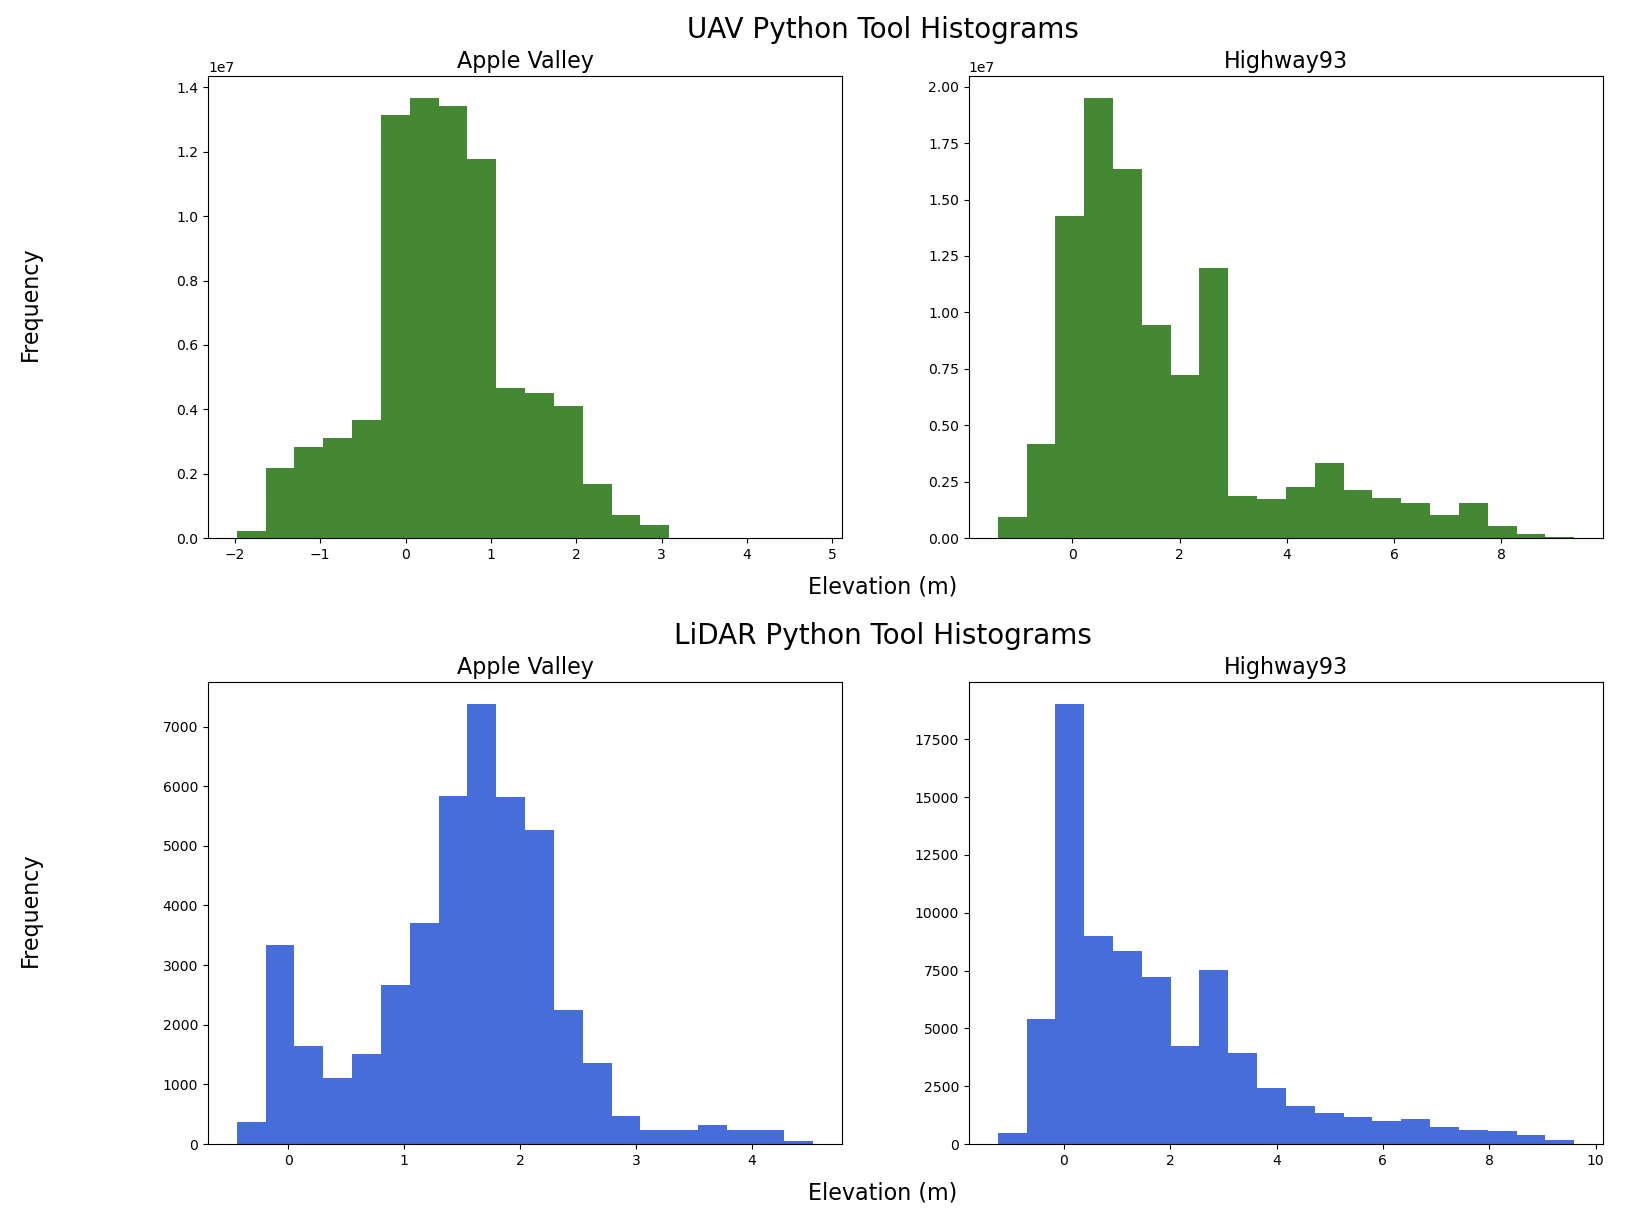
The plots below show the DTMs and their histograms (frequency plots) for two contrasting sites - Apple Valley, which is a relatively less complex/connected site, and Highway 93, which is more complex and connected as indicated by the presence of side channels, pools, and other features. The similarity of the DTMs and histograms is an indicator that so far, the two methods (UAV and LiDAR) are performing comparably with respect to their ability to discern elevational changes on the Earth's surface. Notice that the units of the plots are different - the LiDAR DTMs are in feet, while the UAV DTMs are in meters. We convert the units before generating the REMs in the next step for easier comparison.
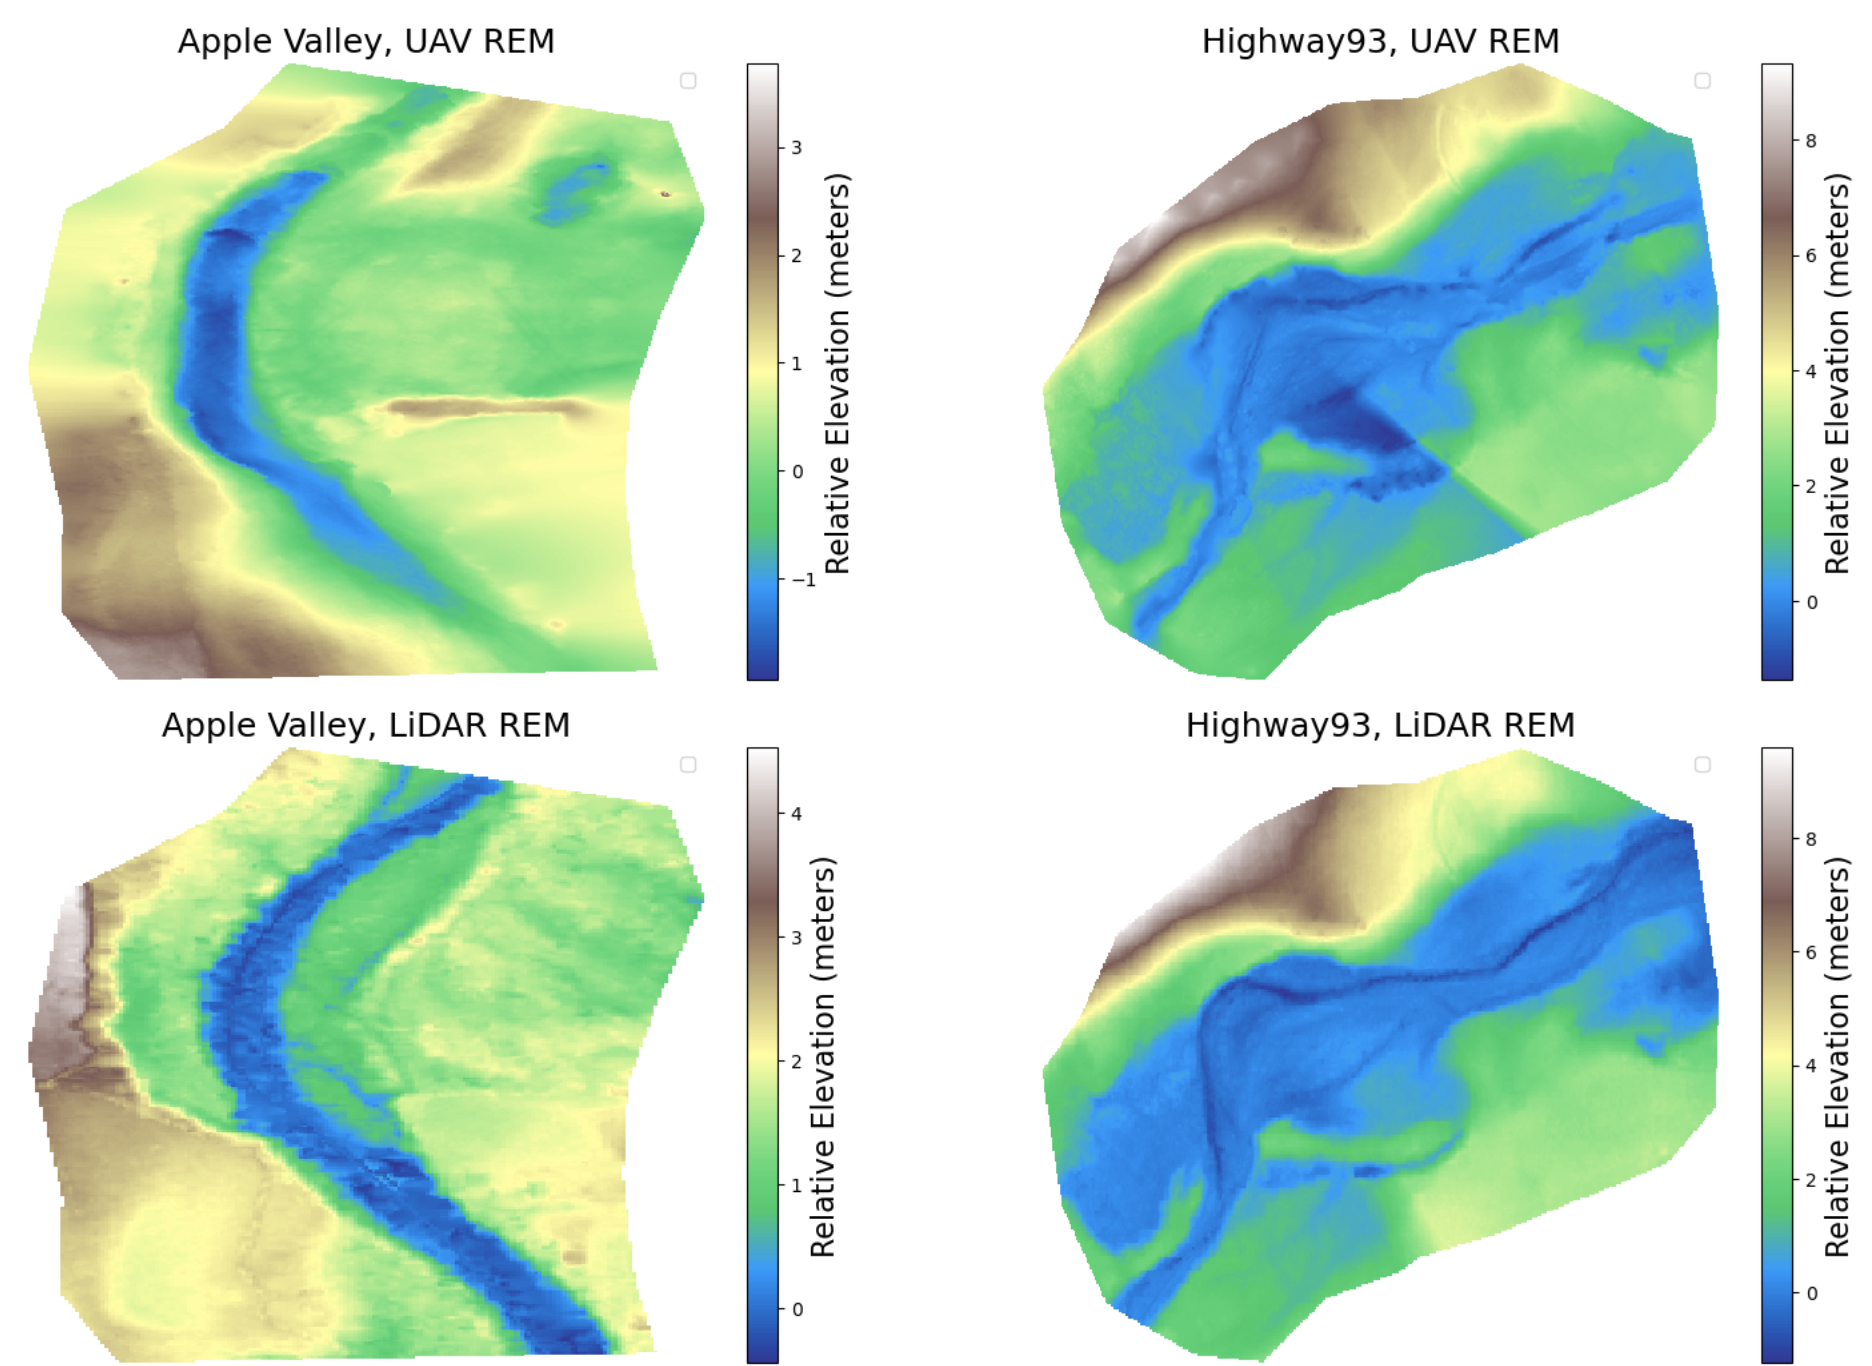
Methods- Visualizing the UAV and LiDAR REMs with Raster Plots and Histograms
Application and Discussion- Flood Simulation
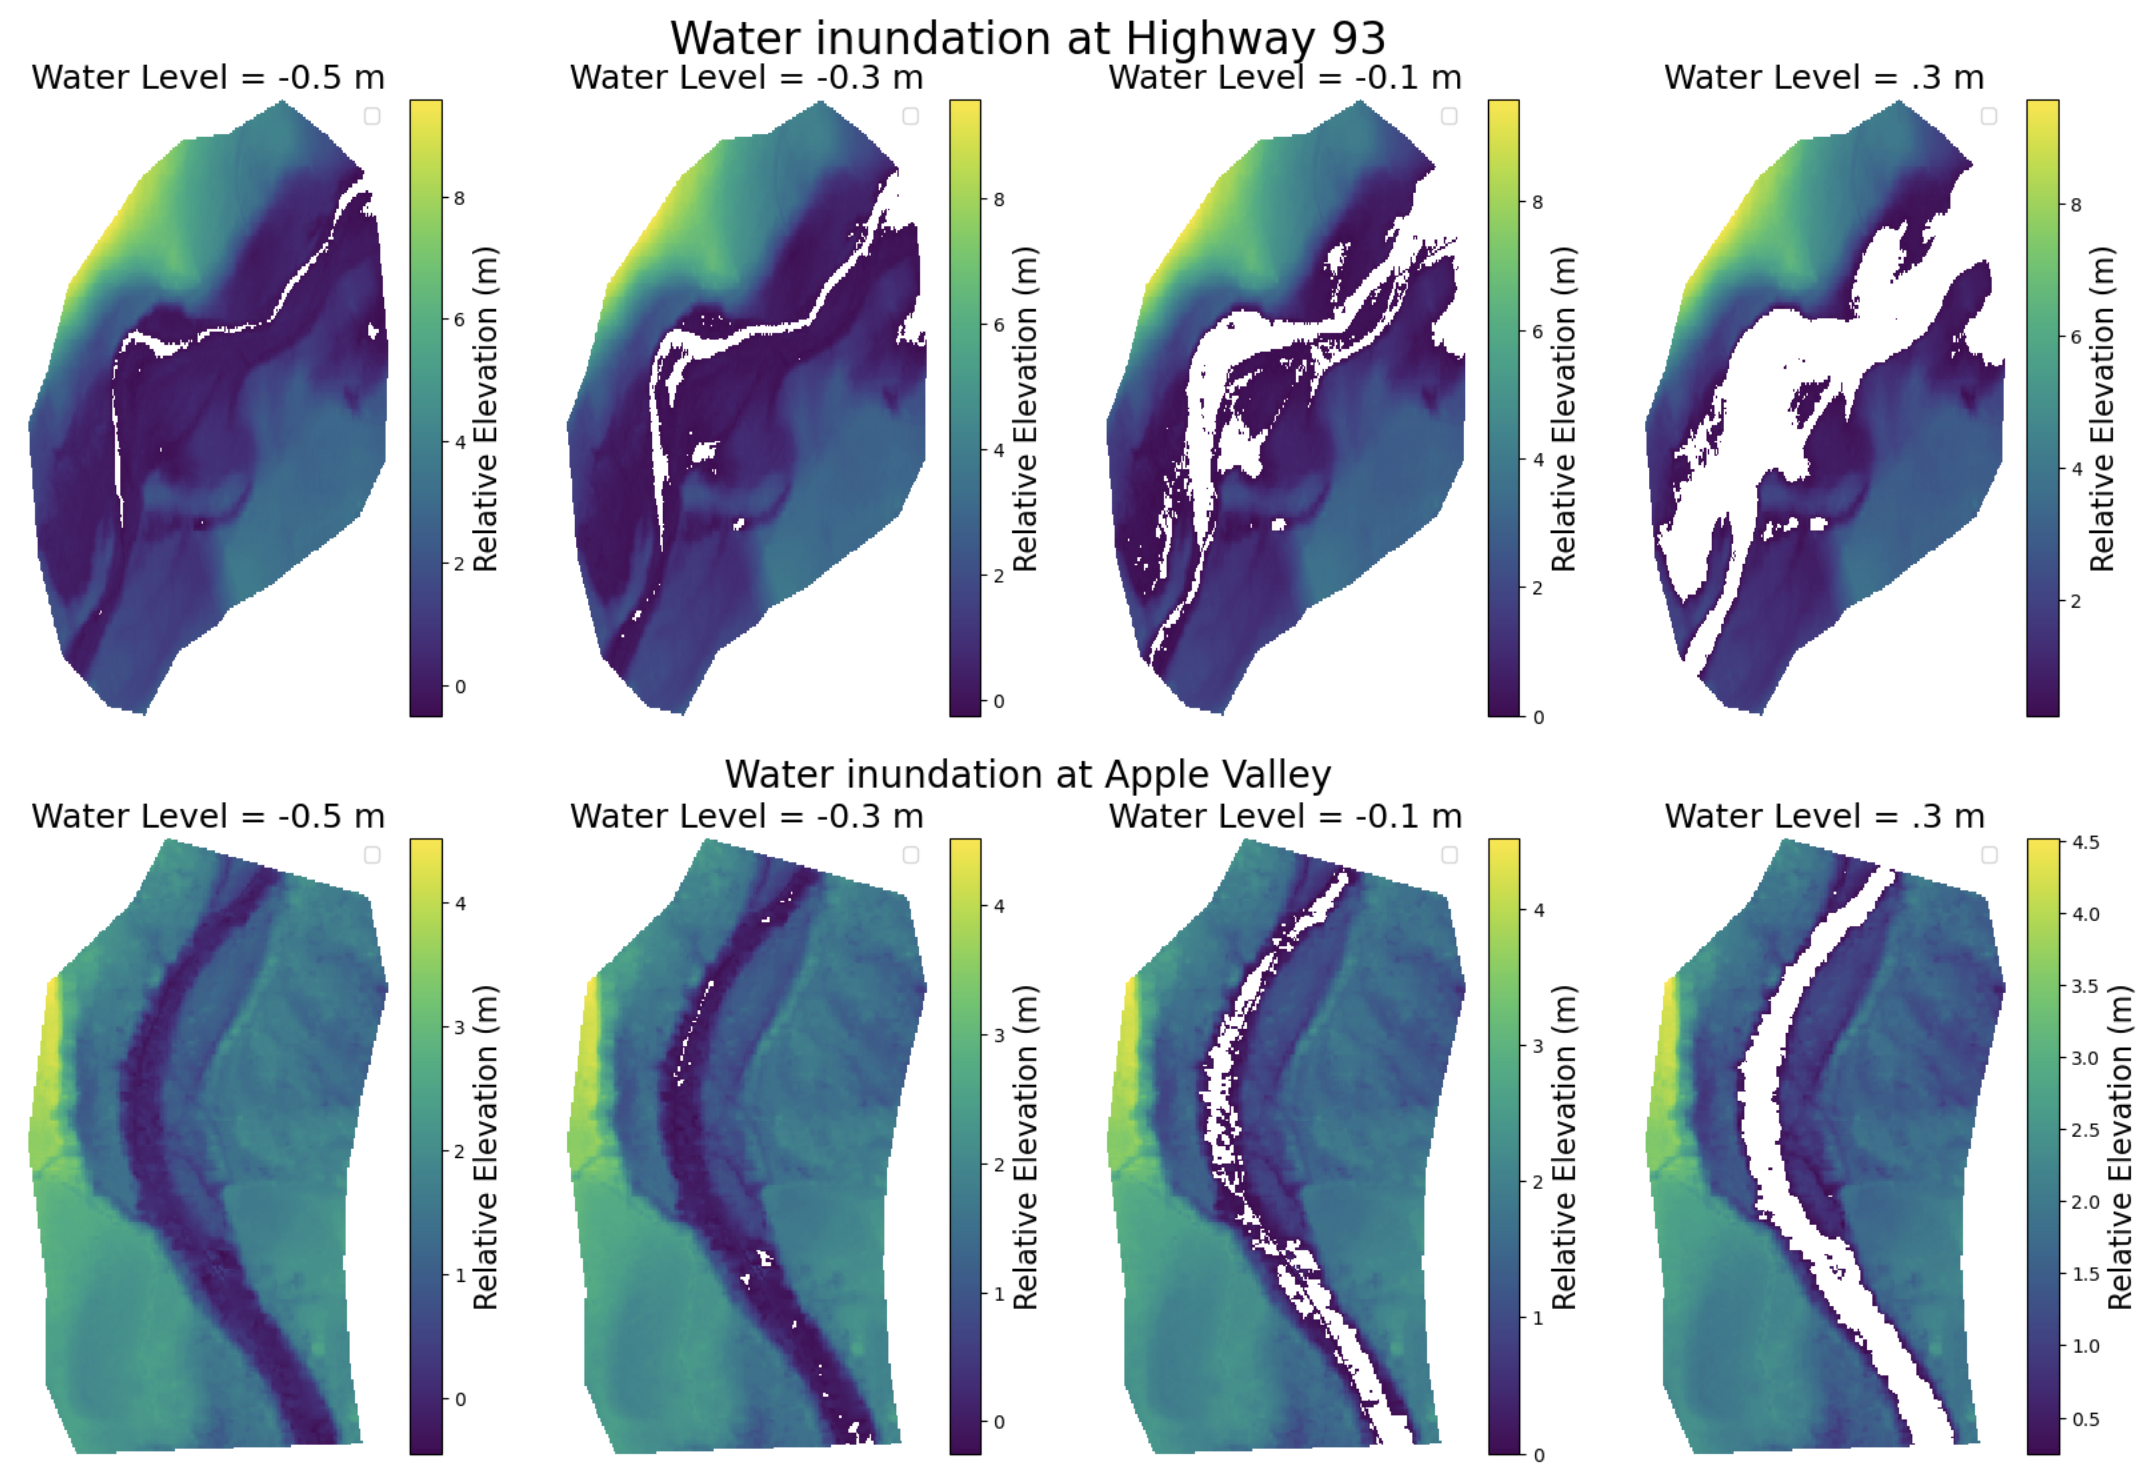
A flood map shows the area that would become inundated if the water level rises to a given elevation. We conducted a very basic simulation where we sequentially increased the elevation to a threshold elevation that represents the water level from a flooding event, and assumed that any pixel in the REM raster below the threshold would become inundated.
The plots below demonstrate how a more complex and connected floodplain can help mitigate flood effects by storing water as water levels rise. It is able to do this because of the low elevation pools and channels that can effectively hold water because "water always takes the low road". To view the animated simulation, please go to our github site and run this notebook taking-the-low-road-blog.ipynb
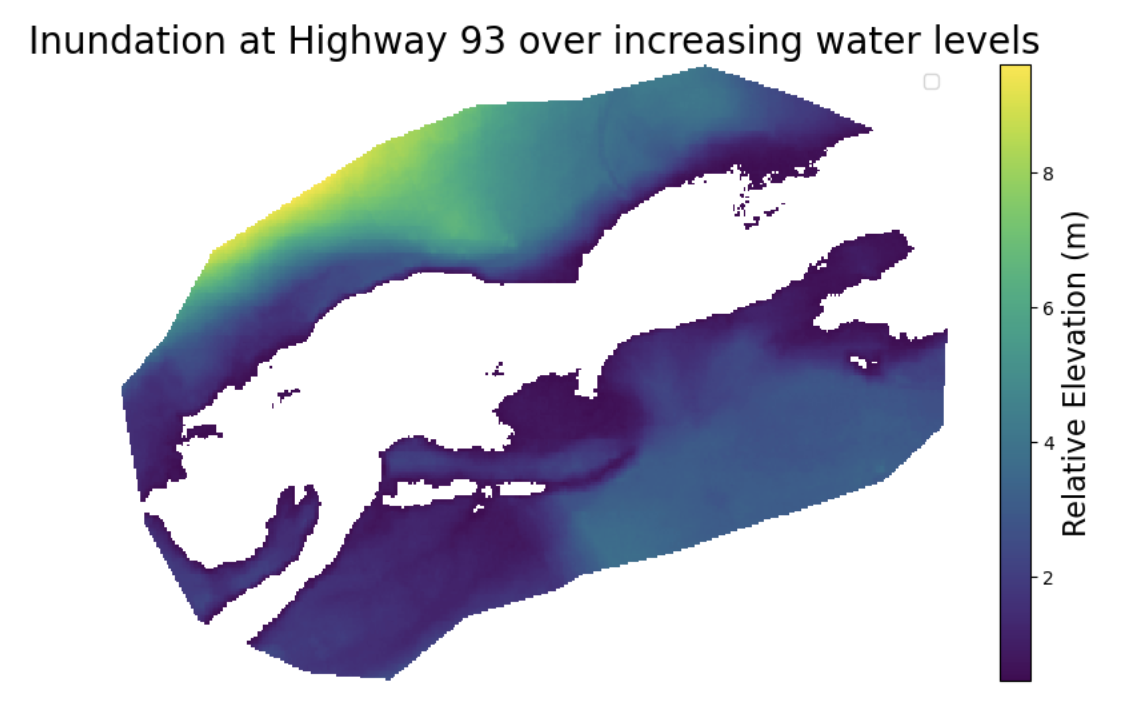
In the simulation below, the Highway 93 site has more complexity and is well-connected to its floodplain. Noticed how the white water slowly pools and spreads out, taking advantage of the multiple side channels and depressions. It's apparent that increased connectivity of the system means greater inundation and less water downstream.
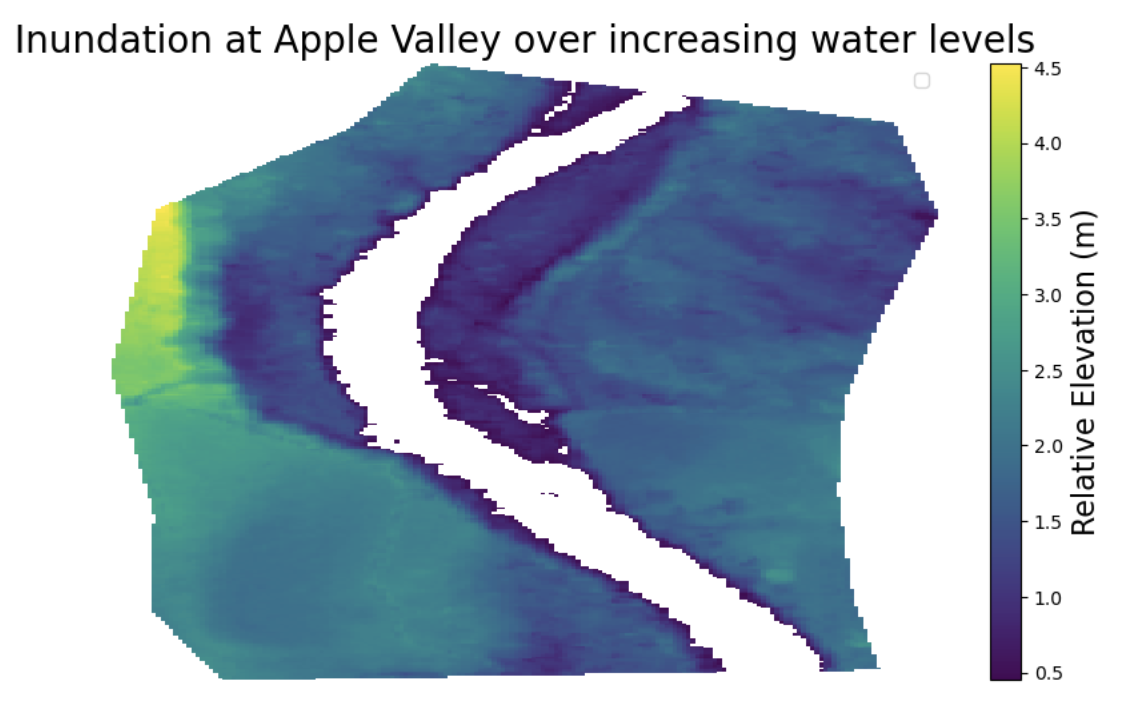
In contrast, the Apple Valley site has no accessible side channels and the stream is too low to access its floodplain. As the water level increases, the channel remains the same. The energy of the flood will remain at the same level as it passes through this system, which may erode the banks and cause destruction downstream. Overall, decreased connectivity means less inundation and more water traveling downstream.
Resources
Changed directory to C:\Users\Julia\earth-analytics\st-vrain-rem