After the Burn: Vegetation Regrowth
Mapping Vegetation Regrowth After the Chimney Tops 2 Fire in Great Smoky Mountains National Park
By Heidi Yoon
2016 Chimney Tops 2 Fire
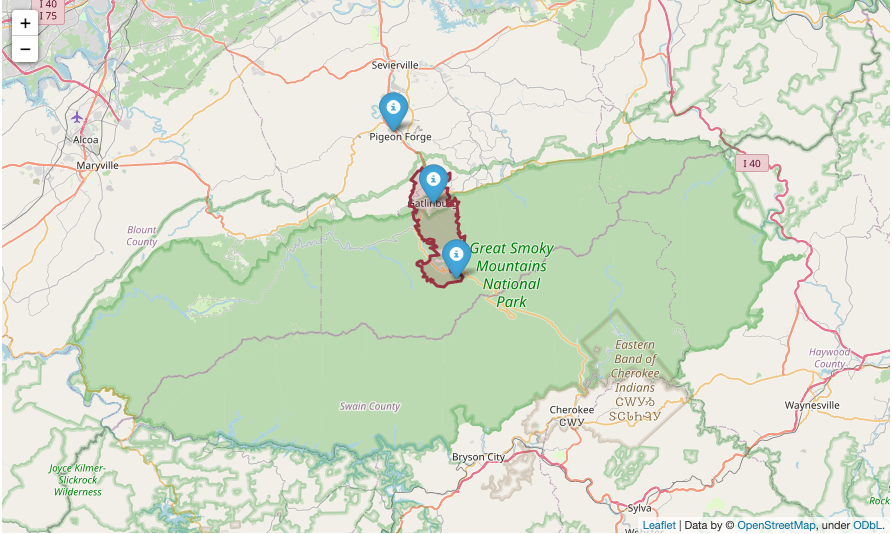
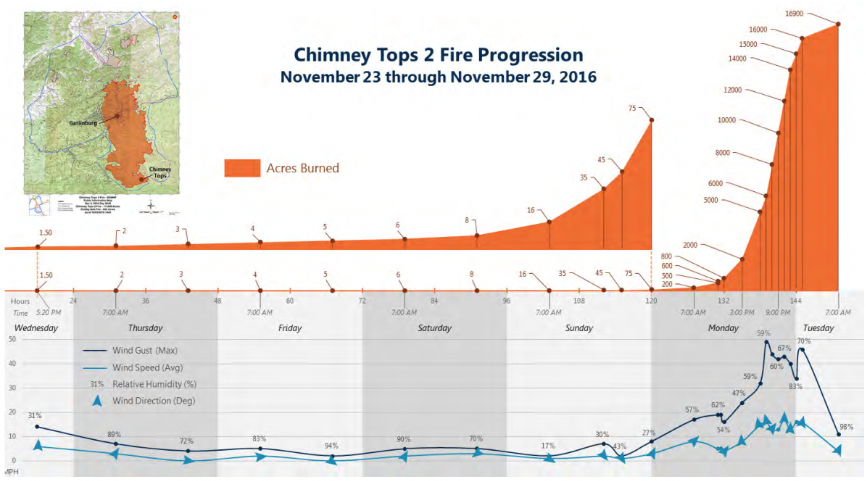
The Chimney Tops 2 Fire began in late November in 2016 on Chimney Tops Mountain in Great Smoky Mountains National Park, as shown in Figure 1. Initially, the Chimney Tops 2 Fire was contained within a 400-acre zone for several days. However, due to unseasonably dry and windy conditions, the fire escaped and grew several orders of magnitude in one day! Figure 2 shows the progression of the fire and how it grew from 75 to 15,000 acres on November 28. After this day, the Chimney Tops 2 Fire joined other fires in Sevier County (see Fig. 1) and burned until December 22, 2016. At least 14 people lost their lives, and over 1600 buildings were damaged or destroyed. Wildfires, such as the Chimney Tops 2 Fire, have become more frequent and more intense. To protect our forests and human communities, we need to understand the effects of fire on our forests.
Determining the severity of a fire can help managers make better decisions
Determining the severity of a fire can help us understand how the forest will recover and if the fire is likely to happen again. Fires that burn along the ground are classified as low severity fires, whereas fires that climb up into the canopy and kill most of the trees are classified as high severity fires. Recent or regular fires can change the structure of a forest to make the forest more resilient to future fires. Characterizing the burn severity will help forest and fire managers to make better decisions regarding fire.
Studying fires remotely will allow us to study more fires with greater coverage and efficiency
Scientists have studied the impact of fires by observing the forest floor directly. For example, Meng et al. 2017 identified and characterized trees, vegetation, and their health in small plots within the burn perimeter of the Crescent Bow Fire. Fieldwork of this kind is time and labor intensive, especially when fires can burn large areas. Within the national park, the Chimney Tops 2 Fire burned about 11,000 acres! It would be an enormous undertaking for a team to study the entire burned area!
As fires have grown in size and severity, there is a greater need to study more fires. One such way is to use remote sensing technologies to study fires from the air or from space. Remote sensing technologies can provide more land area coverage and more frequent measurements to study fires efficiently.
Our Study
We compare reflectance data measured by the Operational Land Imager on the Landsat 8 satellite with those from the NEON Imaging Spectrometer on an airplane. Although the NEON spectrometer has high spatial resolution (1-meter), the reflectance data is typically only available once a year. Although the Landsat 8 imager has lower spatial resolution (30-meter), Landsat 8 orbits the earth every 16 days, so there is more data available.
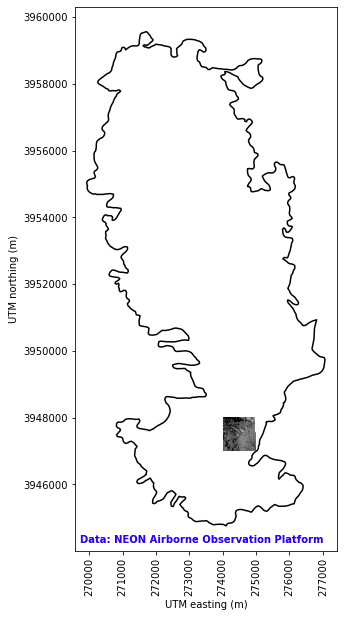
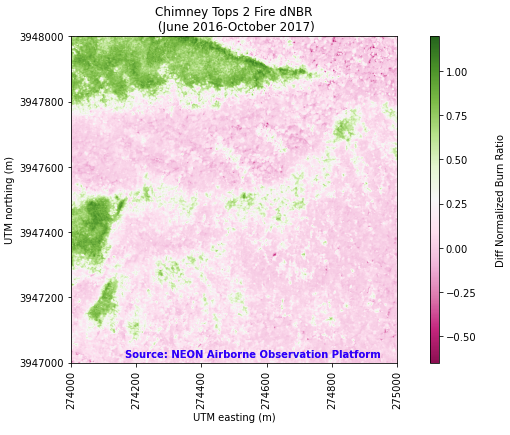
Here is a map of the Chimney Tops 2 Fire Boundary (Figure 3). For our analysis, we will look at one 1-km2 tile within the burned area using data collected from the air by the NEON Spectrometer and with data collected from space by the Landsat 8 Imager.
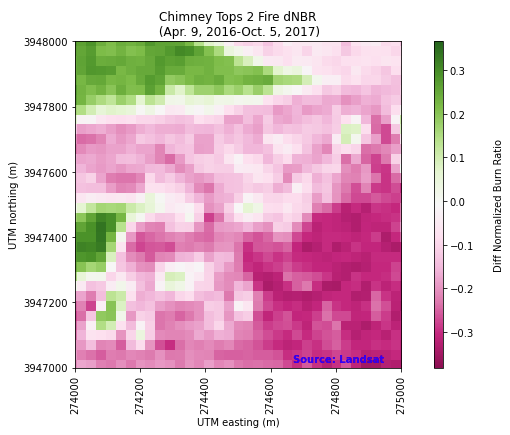
dNBR identifies healthy and burned vegetation
We can calculate the difference normalized burn ratio, or dNBR, to identify healthy vs burned vegetation before and after the fire using Landsat and NEON data.
Next steps
We are also working on a spectral analysis with NEON reflectance data and field data. Learn more about our post-wildfire recovery study below!