How to Differentiate Between Water and Snow in Remote Sensing
By Nathan Korinek
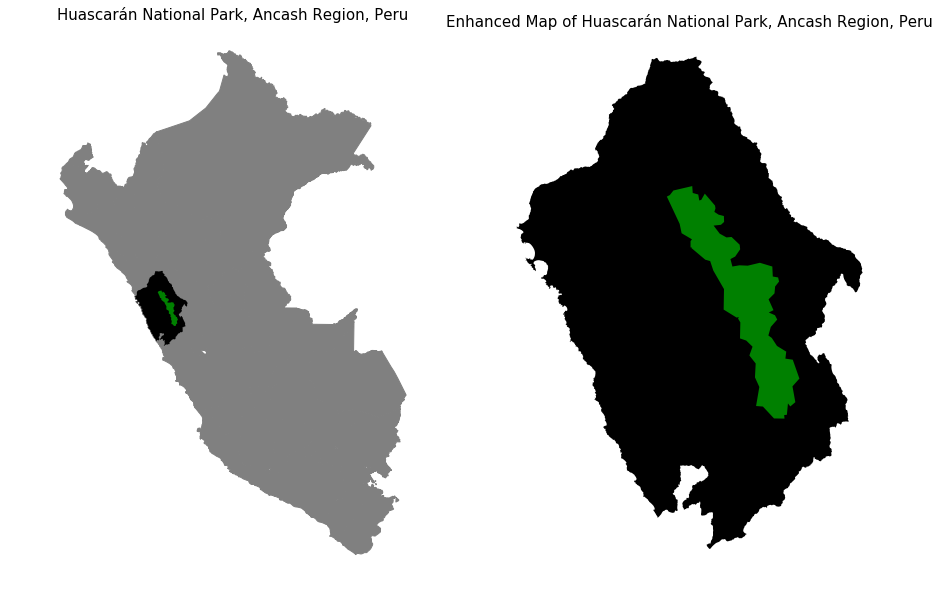
One of the most well known and well documented effects that climate change is having on the world today is the retreat of tropical glaciers around the world. Namely, the tropical glaciers in the Peruvian Andes. One mountain range, the Cordillera Blanca, which is almost entirely located within the newly made Huascarán National Park, holds the majority of the glaciers found in the tropical Peruvian Andes. Below is a map of Peru, with the Ancash Region highlighted Black, and Huascarán National Park highlighted in green.
The Environmental Problem
There have been many very thorough and amazing reports studying the retreat of glaciers in this area, such as a study by (Veettil et al., 2016). There have been similar studies that looked at both the glacial and surface water retreat, such as (Bury et al., 2010). This study relied on ground level measurements and oral data from locals to find the history and change in water level. I wanted to document the water level changes with remote sensing, and here's where my challenge began.
The Coding Problem
I started off by reading papers on the topic. There have been a lot of ways developed to detect water and snow from satellite imagery. The standard way to detect water is with the normalized difference water index (NDWI). This technique uses the green and Near Infrared (NIR) bands to detect water. The difference of waters reflectance in green light and NIR is so great that this technique works generally well to find all water bodies in a study area. In 2006, Hanqui Xu developed an improved method called the modified normalized difference water index (mNDWI) that utilized the difference in reflectance of water in the green and Shortwave Infrared (SWIR) bands to get an even clearer delineation of water bodies. This method is generally considered to be the better method today, and is the most widely used.
To detect snow, there is another difference equation! The normalized difference snow index (NDSI) was developed to find everywhere in a study area where snow exists. This is done by utilizing the difference between the green and SWIR bands to identify snow. It works really well.
However, you may have already seen my issue.
The mNDWI and the NDSI are identical.
So I started researching methods that people use to identify snow and water in an area that has a lot of both. However, the research in this area was very light. In fact, it was almost non existent. The only mention of this issue that I could find in a scientific paper was in Huang et al., 2018. Huang and associates mention that if one were to utilize the mNDWI in an area covered in snow, that it would fail miserably. They suggest using some combination of the mNDWI and a visible band in order to differentiate the snow from the water.
That was all I had to work with going into my project. So I decided to start with the basics.
The Data
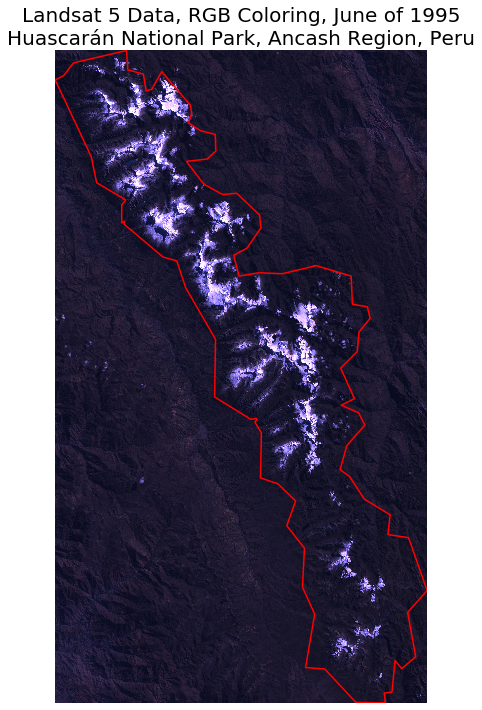
Below is an image taken by Landsat 5 of Huascarán National Park taken in the Summer of 1995. I am displaying the image in true colors, that is using the red, green, and blue bands of data from the satellite to show what the picture would look like to the human eye. I used Landsat 5 and 8 for my study, due to their long term collection of high quality data. No other remote sensing program that is free and available to the public has data that is as high resolution and as consistent. I decided to look at the glacial retreat and surface water change from the mid 80's through the mid 2010's, checking in every decade. I thought that would be a large enough time span to see drastic changes. Outlined in red is Huascarán National Park.
Plotting with NDSI
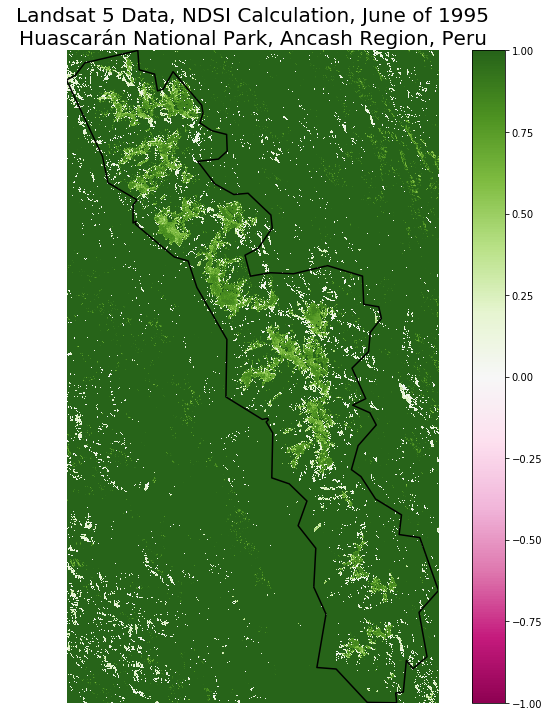
I decided to see what my data would look like if I plotted the NDSI. This was the one that I knew would have a hard time telling the difference between snow and water. In the plot below, you can see the results. From a visual comparison, I discovered the lighter green areas are what have been identified as snow or water. The white scattered throughout are shadows from the mountains, and shouldn't largely affect the data. I was happy with how well this identified the reach of water and snow in the area, but as you can see there is no distinction between the two. I decided to try plotting the NDWI to see what that would look like.
Plotting with NDWI
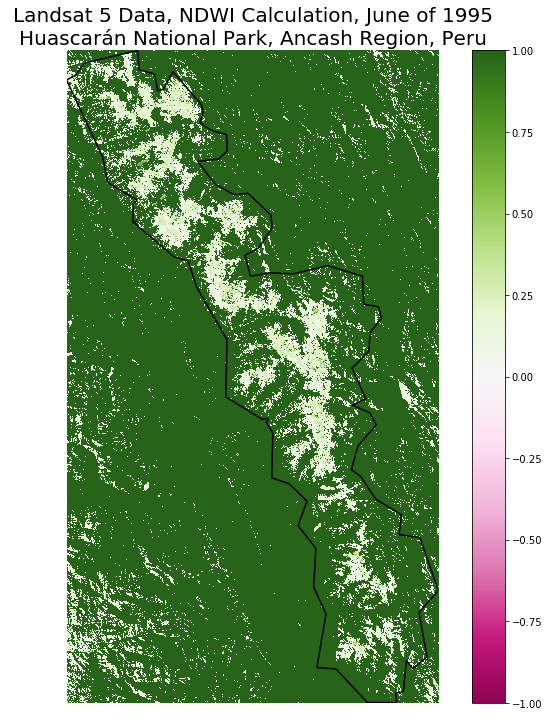
In the plot below, you can see the results of using the "inferior" NDWI. In this plot, it's obvious what the equation thought was snow. It's in white. However, you will notice it's indistinguishable from the shadows, and the borders are much more blurry and less clean. The water bodies, on the other hand, are well outlined! From a visual check, I was pleased with this functions identification of water. Now, I just needed to find a way to combine the two datasets to create one dataset that could identify both water and snow.
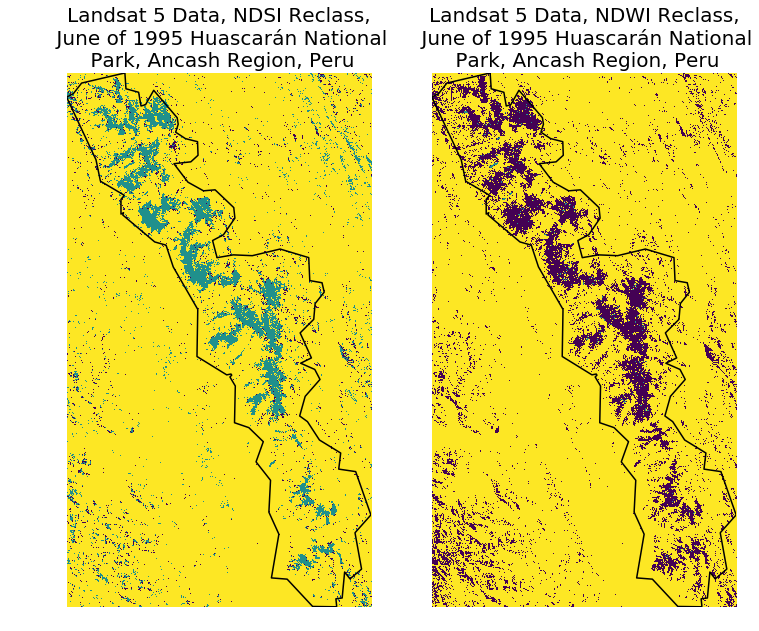
Creating Classes
My plan is this: I will classify the data into what I think is snow and what I think is water, and then combine the two datasets into one. In the plots below, on the left you can see the NDSI reclassification. As you can see, the snow is well classified, but again not differentiated from the water. On the right, you see the NDWI reclass, which has water in blue, and snow in purple. The water was well classified. The only this left was to combine the two.
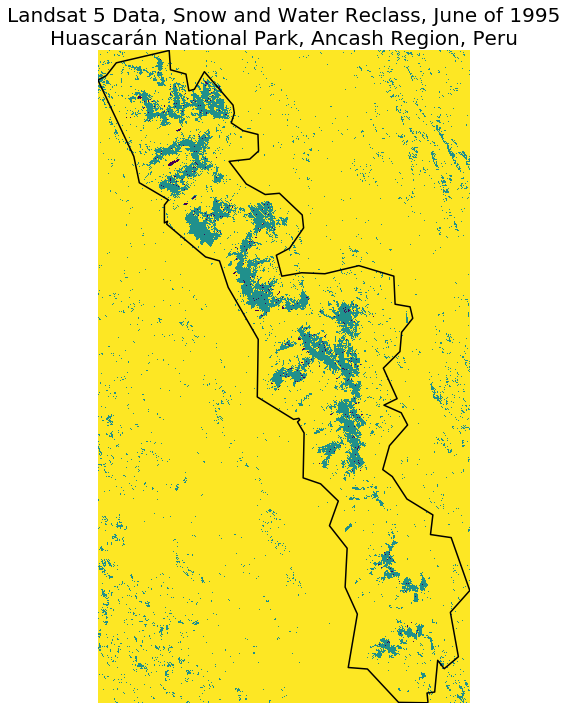
Combining the Classifications
To combine the classifications, I modified the two rasters further. In the NDWI raster, I made it only contain the water areas, and dropped all the snow data. I then added the rasters together. My theory behind this was that if the two rasters agreed that a pixel was water, then that pixel would have a different value then a pixel that they didn't agree was water, AKA snow (hopefully). And as you can see from the below classification, it worked even better than I expected! The snow area was clean, like it was in the NDSI classification, and the water bodies were differentiated, like they were in the NDWI classification! The only thing left was to do this for all years of my data and see the results!
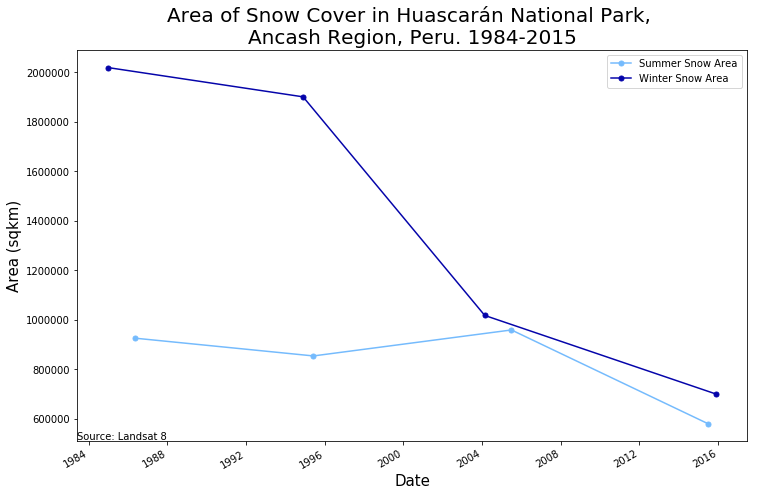
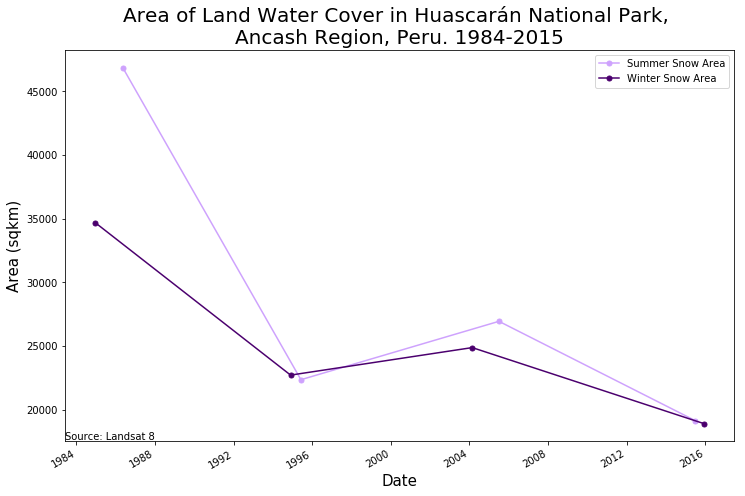
The Results
The results were, sadly, as expected. It is clear from the data that the surface area of snow in the national park went down by almost half in the winter time since 1984, and the summer extent dropped as well. The water area also decreased drastically, falling by a similar amount since 1984. The water extent dropped quicker then the snow cover area, but it seems to have stayed down. This will hurt farming and tourism in the region, and could force migrations away in search of more reliable and safer sources of water.
Bibliography
Bury, J. T., Mark, B. G., Mckenzie, J. M., French, A., Baraer, M., Huh, K. I., . . . López, R. J. (2010). Glacier recession and human vulnerability in the Yanamarey watershed of the Cordillera Blanca, Peru. Climatic Change,105(1-2), 179-206. doi:10.1007/s10584-010-9870-1
Huang, C., Chen, Y., Zhang, S., & Wu, J. (2018). Detecting, Extracting, and Monitoring Surface Water From Space Using Optic Sensors: A Review. Reviews of Geophysics, 56(2), 333-360. doi:10.1029/2018rg000598
Xu, H. (2006). Modification of normalised difference water index (NDWI) to enhance open water features in remotely sensed imagery. International Journal of Remote Sensing, 27(14), 3025-3033. doi:10.1080/01431160600589179
Veettil, B. K., Wang, S., Bremer, U. F., Souza, S. F., & Simões, J. C. (2016). Recent trends in annual snowline variations in the northern wet outer tropics: Case studies from southern Cordillera Blanca, Peru. Theoretical and Applied Climatology,129(1-2), 213-227. doi:10.1007/s00704-016-1775-0