Factors Affecting Emerald Ash Borer Detections in Minnesota Cities
By Rob Hanna, Ian Lippke-Calger, Cara Whalen, Kazuyo Yamaguchi
Emerald Ash Borer (EAB; Agrilus planipennis) is the single most destructive tree pest in North American history. Native to Asia, it has now been detected in the United States, Canada, Russia, Asia, and over half of Europe. Within the United States, EAB has killed hundreds of millions of ash trees across 35 states.
Emerald Ash Borer is hard to detect, slow to grow and is usually fatal to the tree (Figure 1). It can result in billions of dollars for treatment, tree removal and replacement. Emerald Ash Borer infestation and ash tree loss can have significant impacts on property values, tourism and wildlife habitat.

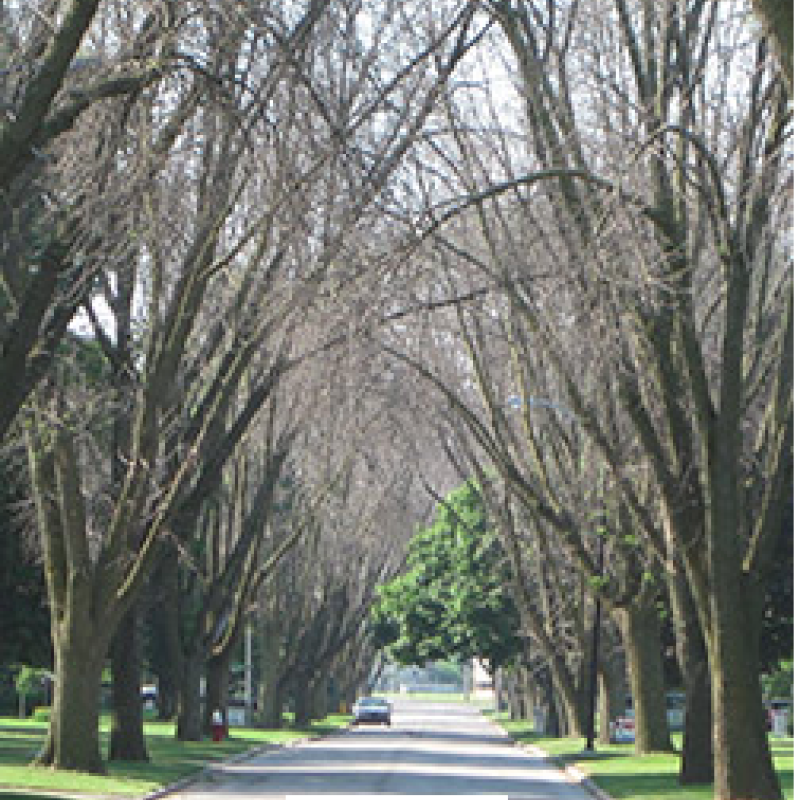
Figure 1. Ash trees before and after Emerald Ash Borer infestation.
STUDY AREA
We chose the state of Minnesota as our study area because it has a comprehensive dataset on EAB. Emerald Ash Borer was discovered in St. Paul in 2009 and has since spread to other parts of the state. There are currently 4,329 cases of EAB in Minnesota (Figure 2).
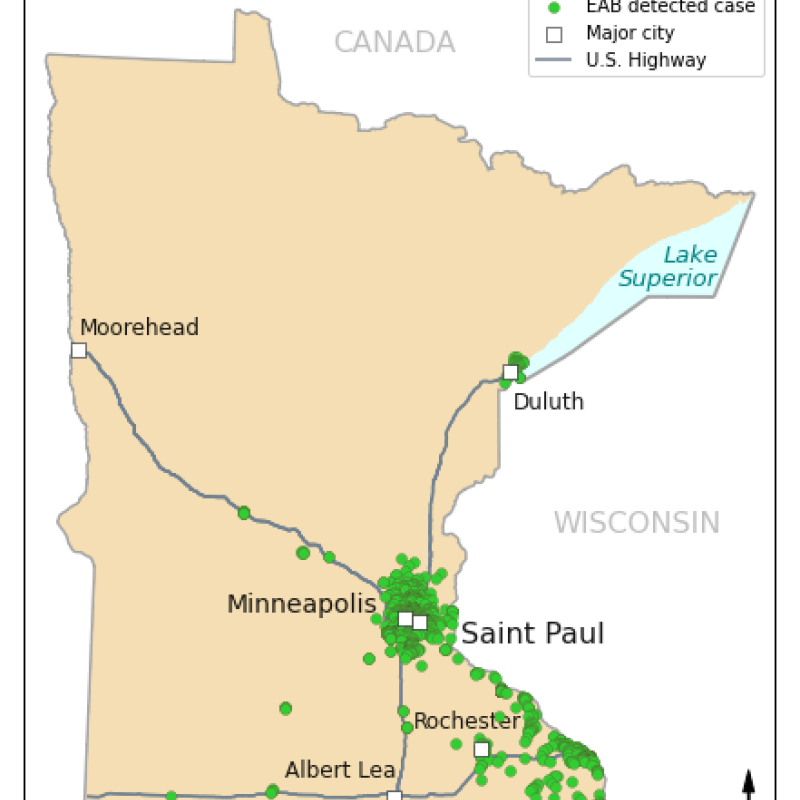
Figure 2. Emerald Ash Borer detections in Minnesota.
While it would have been ideal to include the entire state of Minnesota in our analysis, we did not have all of the data needed for our analysis for the whole state. Thus, our analysis only included the 785 cities for which we had all of the necessary data (Figure 3).
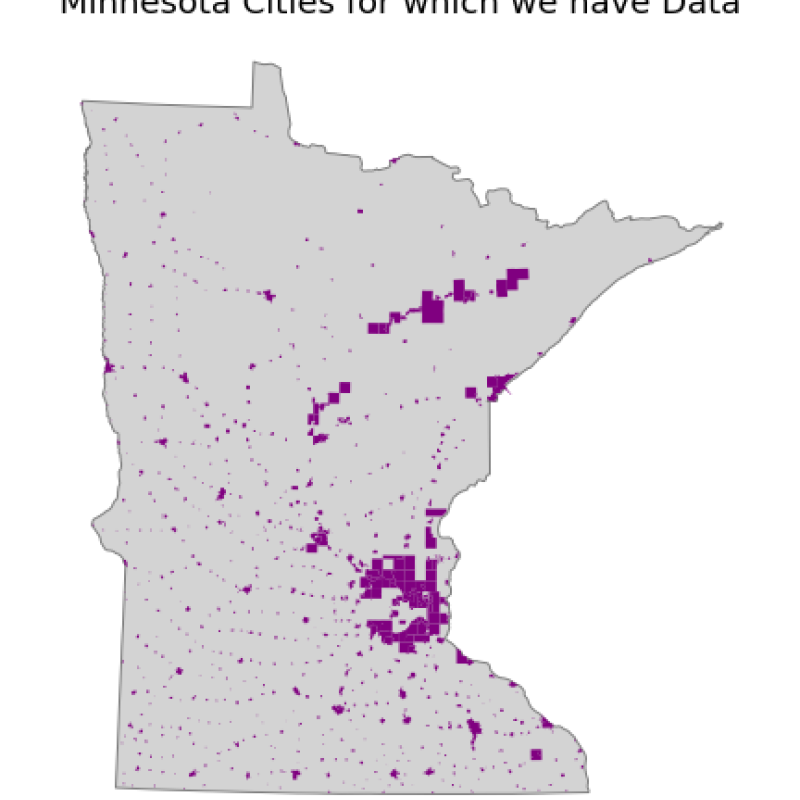
Figure 3. Cities included in the analysis.
ANALYSIS
Our goal for the analysis was to determine which factors are most important in the spread of EAB in Minnesota cities. To accomplish this, we examined the following four factors:
-
Number of ash trees in each city
-
City population size and density
-
Road density of each city
-
Lowest temperature of each city
For each of these factors, we determined whether there is a correlation between the factor and the number of EAB detections.
Number of Ash Trees
We obtained tabular data for the number of ash trees in Minnesota cities. In order to use these data in the analysis, we needed to join the tabular ash tree data with the spatial city data. We used the following code to perform the join:
cities_EAB_join = geopandas.sjoin(ash_tree_shp, EAB_shp)

cities_pivot = pandas.pivot_table(cities_EAB_join,index='FEATURE_NA',columns=('OccStatus'),aggfunc={'FEATURE_NA':len})

cities_pivot.columns = cities_pivot.columns.droplevel()

cities_EAB_counts = ash_tree_shp.merge(cities_pivot, how='left',on='FEATURE_NA')
We also needed to join the EAB detection data to the city polygons. The following code shows how we determined the number of EAB detections within each city polygon and then joined the EAB counts to the city shapefile.
# Spatial join EAB Detections to copy of cities

cities_detections_join = gpd.sjoin(cities,

detections,

how="inner",

op="intersects")


# Simplify join using a pivot table

cities_detections_pivot = pd.pivot_table(cities_detections_join,

                                         index='FEATURE_NA',

                                         columns=('OccStatus'),

                                         aggfunc={'FEATURE_NA':len})


# Drop the index field 'FEATURE_NA’; droplevel() default is zero

cities_detections_pivot.columns = cities_detections_pivot.columns.droplevel(0)


# Merge original cities with detections processed above

cities = cities.merge(cities_detections_pivot,

how='left',

on='FEATURE_NA')
By joining the ash tree and EAB detection data to the city polygons, we were able to plot the number of ash trees and the number of EAB detections in Minnesota cities (Figure 4).
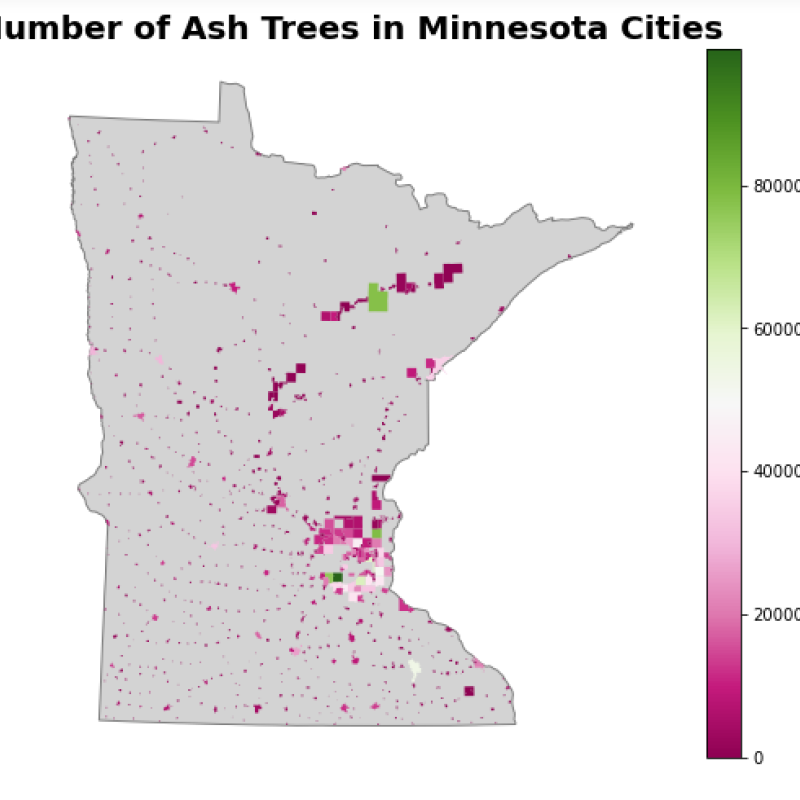
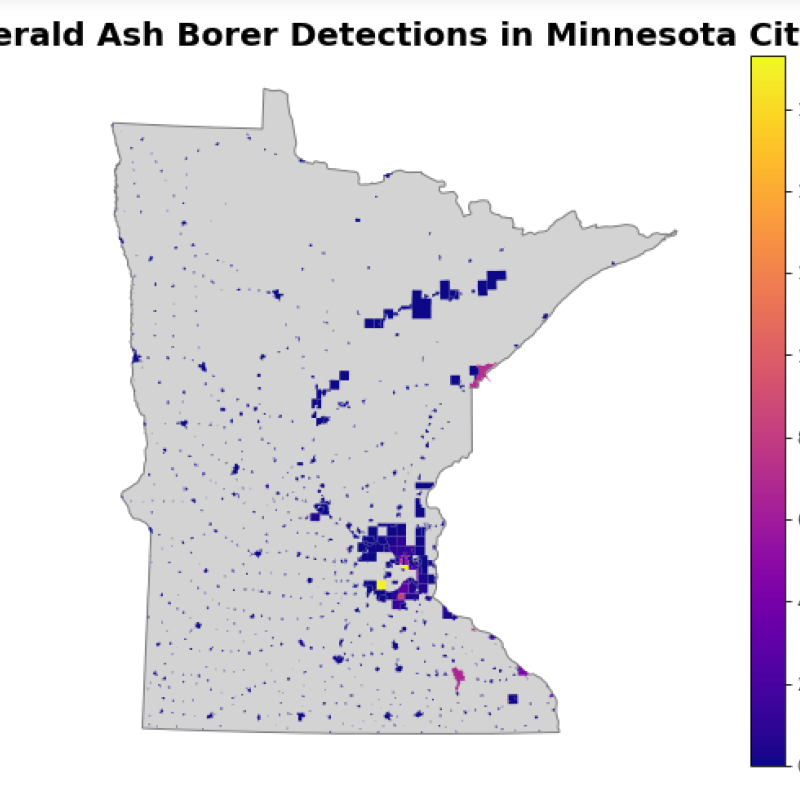
Figure 4. Plots of the number of ash trees and number of EAB detections in Minnesota cities.
We wanted to find out if there is a relationship between the number of ash trees and the number of EAB detections in each of the cities. To accomplish this, we conducted a correlation analysis to test the relationship between these two variables using the following code:
corr_number_ash_number_EAB = numpy.corrcoef(number_ash_trees, number_EAB_detections)The analysis resulted in a correlation coefficient of 0.442, which indicates there is a weak positive relationship between the number of ash trees and the number of EAB detections in Minnesota cities (Figure 5).
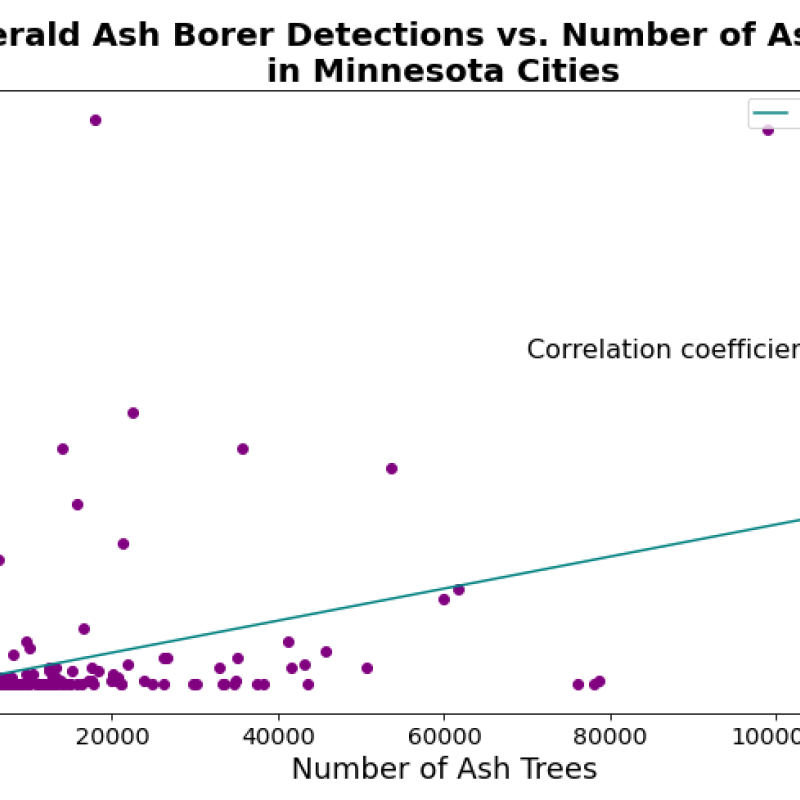
Figure 5. Correlation between the number of ash trees and the number of Emerald Ash Borer detections in Minnesota cities.
Population Size and Density
Although the EAB typically flies a half mile from its emergence tree to another to lay eggs, humans are thought to spread EAB farther distances by moving infected firewood. We considered the possible relationship between EAB detections and human population; we examined both city population and population density. Figure 6 shows the distribution of population size and density in Minnesota cities.
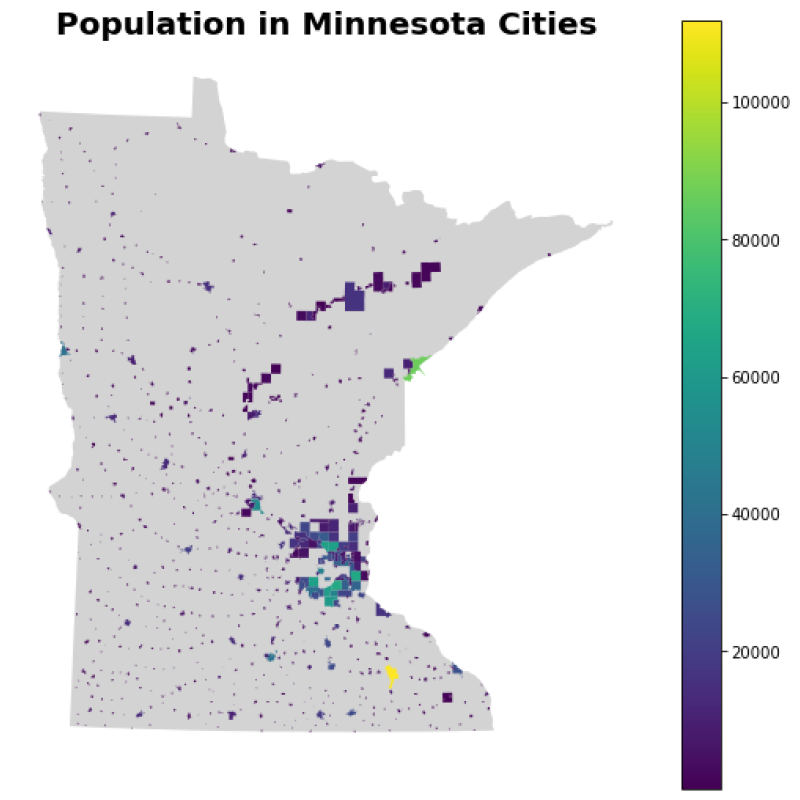
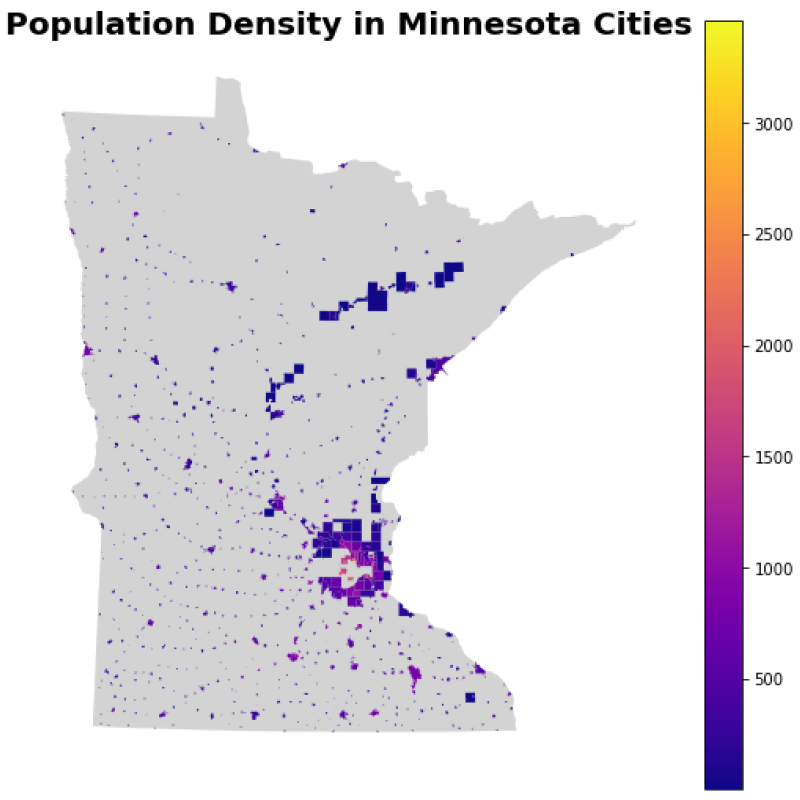
Figure 6. Population and population density in Minnesota cities.
The correlation coefficient between the population and the EAB detections was 0.491, indicating a weak positive relationship (Fig. 7). A linear regression line in the figure suggests approximately an increase of 5 EAB detections per a population increase of 10,000 people.
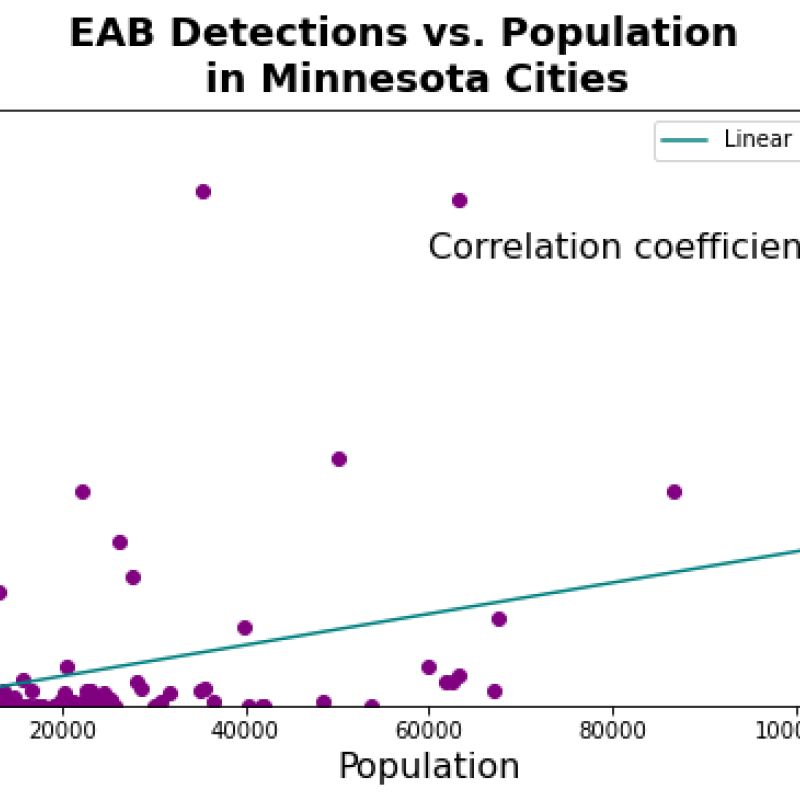
Figure 7. Correlation between population and EAB detections in Minnesota cities.
As seen in Figure 7, the dot distribution indicates a very minor relationship between population density and EAB detections. Their correlation coefficient was 0.193. Considering the distribution and correlation coefficient, we concluded that there is no relationship between them. However, we found an interesting trend on the plot; cities with many EAB detections have a population density between 400 and 1,300 people per km2 (Figure 8). The distributions raised some questions: Do cities with larger population densities have fewer ash trees because they are too urban? Do cities with small population densities have less chance to get EAB regardless of the number of ash trees because there are not as many people to bring EAB to the city?
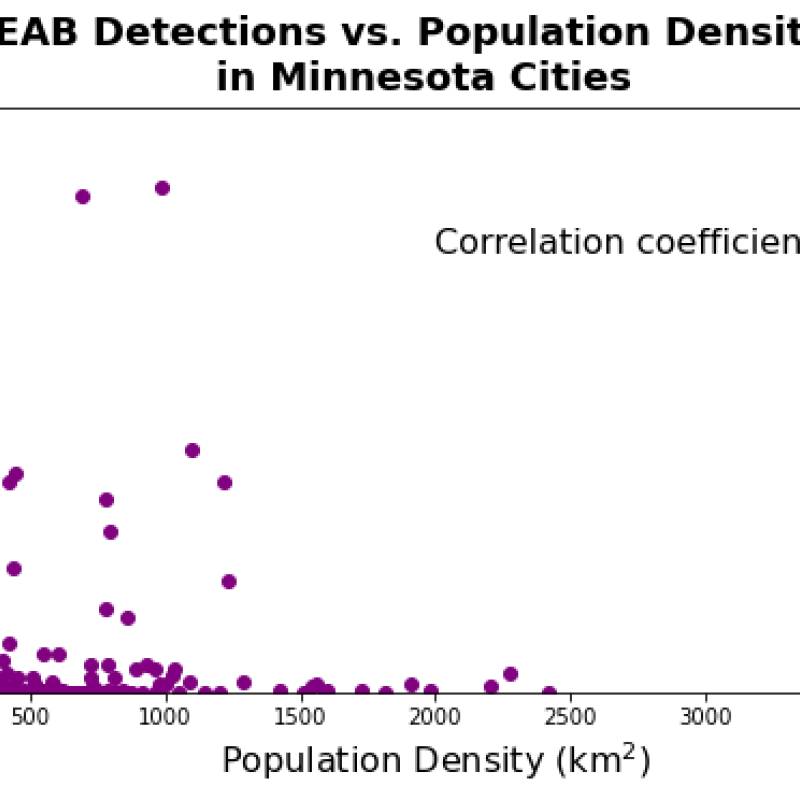
Figure 8. Correlation between population density and EAB detections in Minnesota cities.
To gain insight to these questions, we considered a distribution of the EAB detections as a function of the ash tree and population densities. Figure 9 suggests that cities with a population density between 400 and 1,300 people per km2 and an ash tree density between 100 and 1,100 per km2have more EAB detections.
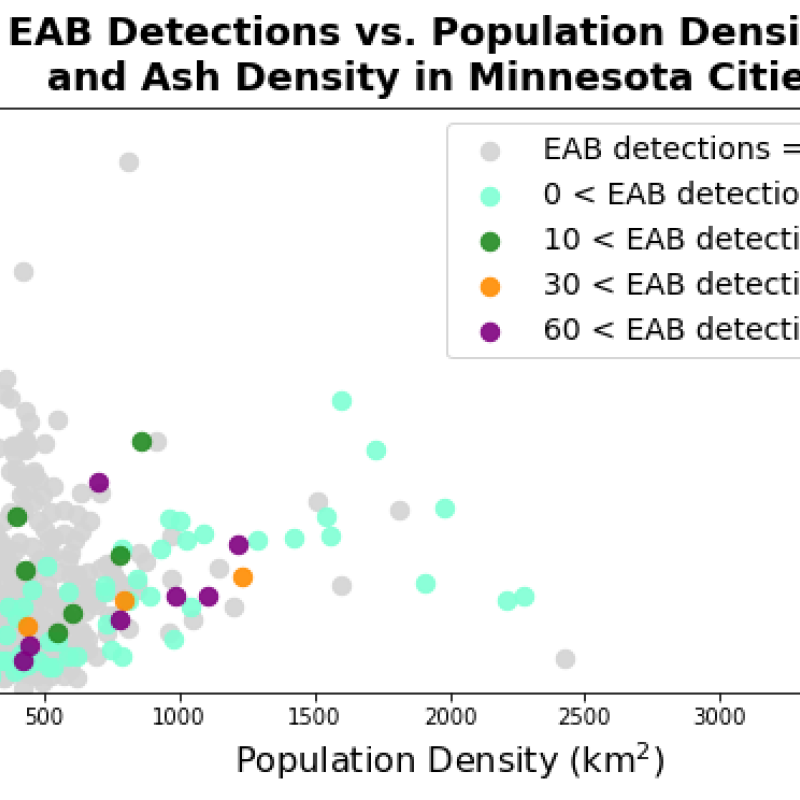
Figure 9. EAB detections in relation to ash tree density and population density.
Road Density
Another factor that could affect the spread of EAB is road density. Knowing that chopped wood is one way an infestation can spread, the thought was higher road density in a given area could represent such movement.
The standard formula for road density is cumulative length of roads (in miles) / square miles for a given city/town. We performed area calculations on the cities that have both total and ash tree counts.
For combined road length, included only major roads, major secondary roads and state roads but not side streets, residential streets, and drives, avenues, boulevards.
As we calculated road density, we quickly noticed a significant number of irregular data points (Figure 10). Investigations showed that some “cities” had very small square mileage, but had many major roads running through them. This usually occurred within bigger cities, such as Minneapolis.
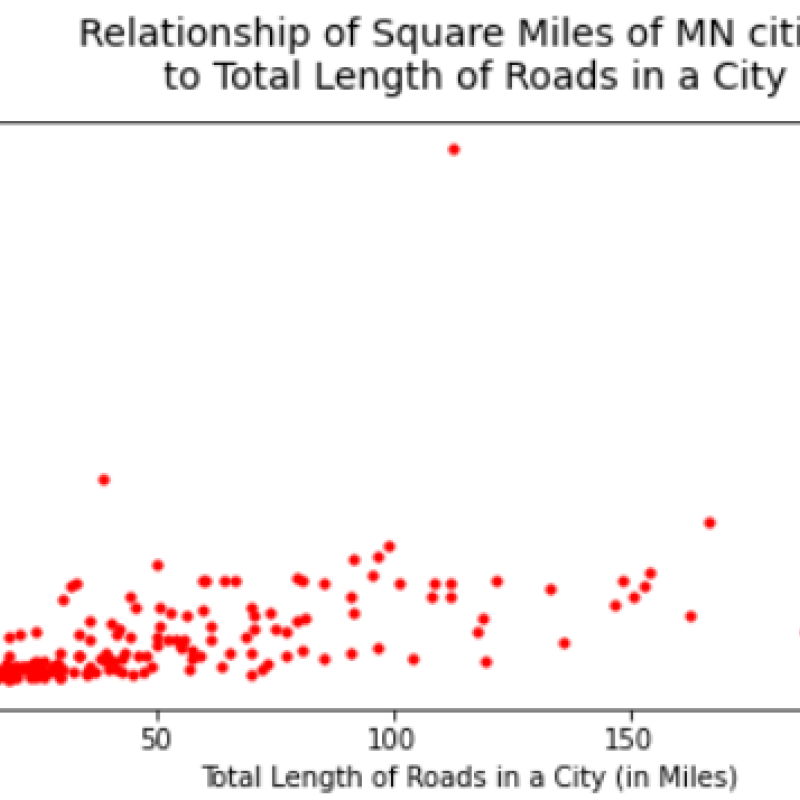
Figure 10. Relationship of square miles to total length of roads in a city/town.
By calculating a correlation value from road density to EAB infestations within a given city area, we found a very small relationship, with a correlation number of just 0.021 (Figure 11).
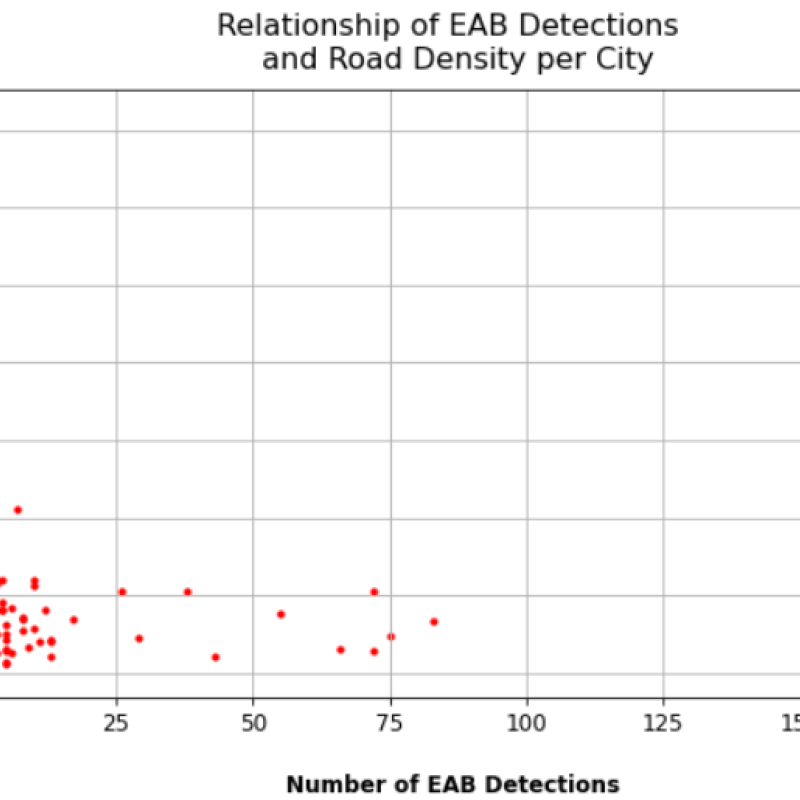
Figure 11. Relationship of EAB detections and road density per city/town.
Temperature
The relationship between temperature and EAB seems clear when represented visually. EAB detections are seemingly more common in areas of light blue, which indicate higher temperatures, and appear to drop off as low temperatures become more extreme in Northern Minnesota. (Figure 12)
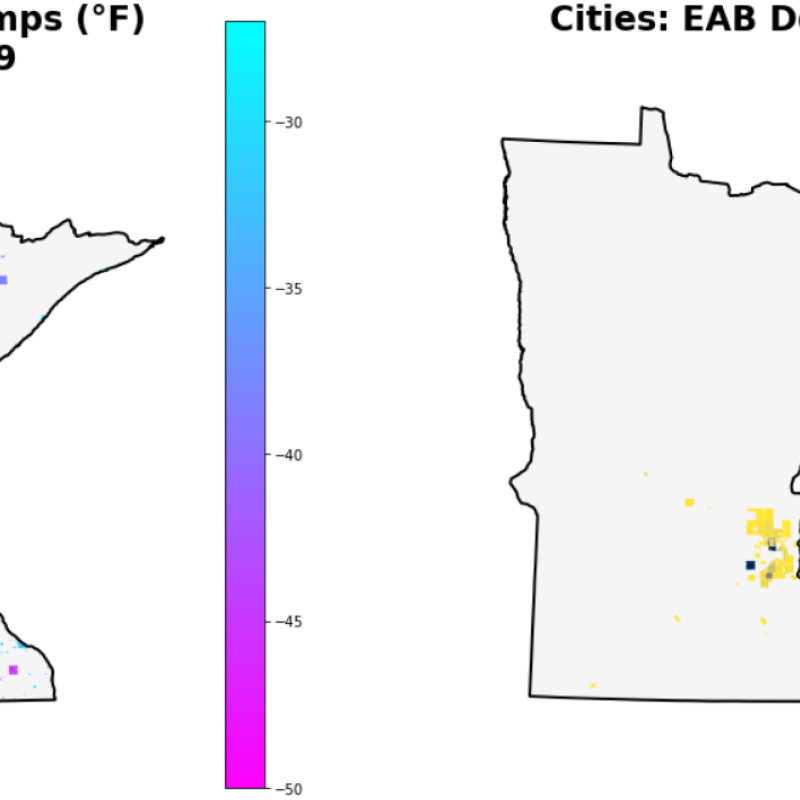
Figure 12. Weather station temperature records attached to cities, EAB detections by city
Spatial Join via Centroid: Weather Station Temperatures to Cities
An integral part of analyzing the relationship between low temperature and EAB infections is the spatial join of low temperature data recorded at Minnesota’s array of weather stations to Minnesota’s cities. This join was accomplished by generating a new field containing the centroid of each city (cities["centroid"] = cities.centroid) and defining a new function (nearest, below) to match the centroids to the nearest weather station datapoint.
def nearest(row, geom_union, df1, df2, geom1_col='geometry', geom2_col='geometry', src_column=None):

"""Find the nearest point and return the corresponding value from specified column."""

# Find the geometry that is closest

nearest = df2[geom2_col] == nearest_points(row[geom1_col], geom_union)[1]

# Get the corresponding value from df2 (matching is based on the geometry)

value = df2[nearest][src_column].values

value = int(value[0])

return value
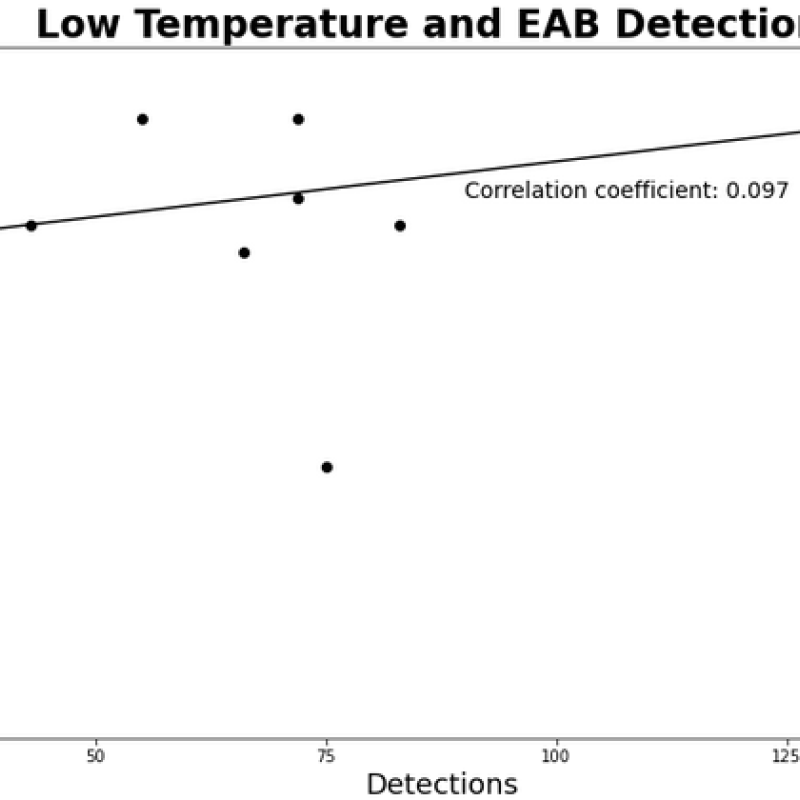
Figure 13. Correlation analysis results
The correlation analysis (Figure 13) yielded a coefficient of 0.097. This coefficient represents a weak positive correlation, affected slightly by the extent of the city boundaries which excluded some of EAB detections in the Minneapolis area. The same analysis on a county level yields a coefficient of 0.104.
Summary
Below is a summary of the results of our analyses.
|
Factor |
Correlation Coefficient |
Relationship |
|
Number of Ash Trees |
0.442 |
Weak Positive |
|
Population |
0.491 |
Weak Positive |
|
Population Density |
0.193 |
Very Weak Positive |
|
Road Density |
0.021 |
Very Weak Positive |
|
Extreme Low Temperature |
0.097 |
Very Weak Positive |
None of the factors we selected for the analysis had a strong relationship to the number of EAB detections in Minnesota cities. Of these factors, the strongest correlations were the number of ash trees and the human population in a given city.
Future Work
This analysis is an important step in understanding the factors that contribute to EAB infestation, but there is still much work that needs to be done. Data should be collected about treated ash trees, and more data could be collected on both public and private property for deeper analysis. Campgrounds may be a significant contributing factor. Larger cities could be analyzed more closely to identify trends in populous areas. In the future, this analysis could be used to build predictive tools for predicting and managing the spread of EAB.
WORKS CITED
Ash Tree Data, Minnesota Department of Natural Resources, https://files.dnr.state.mn.us/assistance/backyard/treecare/forest_health/ash_elmRapidAssessment/rapidassessment_AshElm.pdf, Last Accessed: July 20, 2020
City, Township, and Unorganized Territory in Minnesota, Minnesota Geospatial Commons, https://gisdata.mn.gov/dataset/bdry-mn-city-township-unorg, Last Accessed: July 30, 2020
Emerald ash borer, Agrilus planipennis, EDDMaps, University of Georgia, Center for Invasive Species and Ecosystems Health, https://www.eddmaps.org/distribution/viewmap.cfm?forcelogin&sub=7171, Last Accessed: Jul 8, 2020
Emerald Ash Borer Information Network,
http://www.emeraldashborer.info/, Last Accessed: August 11, 2020
Emerald Ash Borer Program, Minnesota Department of Agriculture,
https://www.mda.state.mn.us/eab, Last Accessed: August 11, 2020
Minnesota Long Term Climate Sites, Iowa Environmental IsoNet (Mesonet) / Iowa State University, https://mesonet.agron.iastate.edu/climodat/monitor.php?network=MNCLIMATE&sdate=05%2F01%2F2020&edate=12%2F31%2F2020&s%5B%5D=MN0018, Last Accessed: July 30, 2020
MnDOT Route Centerlines, Minnesota Geospatial Commons,
https://gisdata.mn.gov/dataset/trans-roads-centerlines, Last Accessed: August 3, 2020