Bird Behaviors within the Prairie Pothole Region
Bird Behaviors within the Prairie Pothole Region
Bird Behaviors within the Prairie Pothole Region
Jayce Archambault, Abby DeCoteau, Cole Grant
Faculty Mentors: Emily Biggane and Jessica Logan
United Tribes Technical College
August 8th, 2022
Introduction
1. Study Area:
The Prairie Pothole Region (PPR) is composed of depressional freshwater wetlands located in the upper Midwest, including: North Dakota, South Dakota, Iowa, Montana, Minnesota, and three Canadian provinces (Figure 1). It was created in a formerly glaciated landscape that has been imprinted with a vast number of potholes that fill with snowmelt and rain in the spring providing both temporary and permanent wetland habitat for many animals, especially birds (EPA.gov).
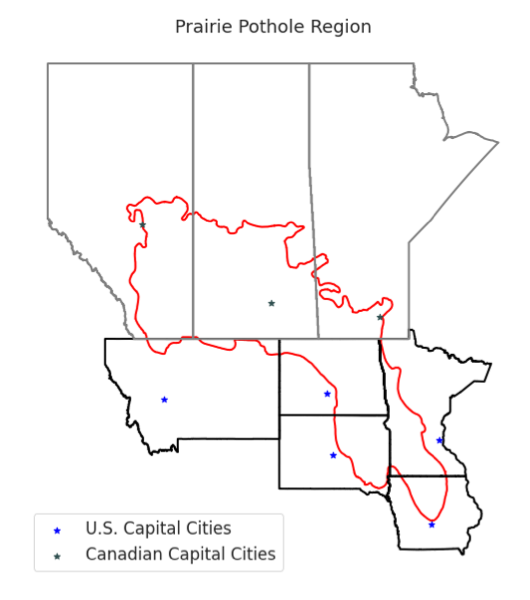
Figure 1. Map of the Prairie Pothole Region (in red) overlaid on the U.S. states and Canadian provinces it lies within.
2. Avian wildlife within the PPR:
The PPR encompasses valuable seasonal wetlands that support rich plant and animal life (Figure 2). It is home to more than 50 percent of migratory waterfowl (nwf.org). Millions of ducks and waterfowl come to the PPR every year to feed, breed, and raise young. The 64 million acres of prairie potholes in the United States support at least 18 waterfowl species, 96 songbird species, 36 waterbird species, 17 raptor species, and 5 upland game bird species (nwf.org).
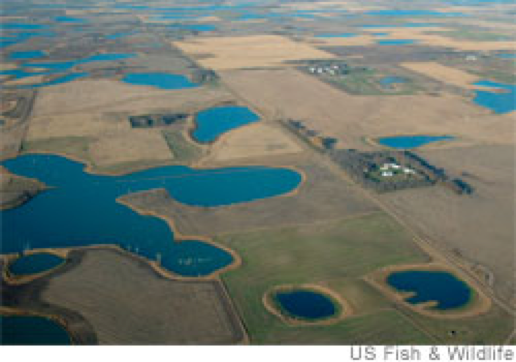
Figure 2. U.S. Fish & Wildlife image of PPR wetlands.
3. The Piping Plover:
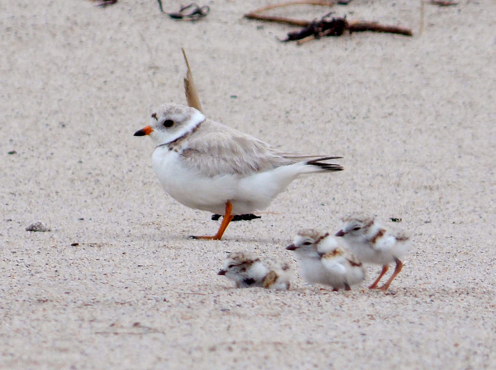
One federally threatened species of shorebird that inhabits the PPR is the piping plover (Figure 3). These small birds can only be found in two different regions of the U.S., the northern oceans and shores and the northern Great Plains lakeshores, rivers, and wetlands. They nest in sandy shorelines of lakes, rivers, and wetlands and feed on freshwater and marine invertebrates. This small bird’s preferred nesting habitat makes them particularly vulnerable to habitat change and as a result they are on the threatened and endangered species list in part due to wetland drainage and climate change. They are spending more time searching for nesting sites than they are breeding, impacting the population (nrcs.usda.gov).
Figure 3. Google image of piping plover mother and fledglings.
4. Red-tailed hawk:
Although the Red-tailed hawk is not endangered nor does it rely solely on the Prairie Pothole Region (PPR), they do use the PPR along with hundreds of other unique birds. They can be found around the world but their preferred area is any area with interspersed trees; where they can perch at a higher elevation. The PPR is filled with diverse species of small game, fish, birds, reptiles, and other mammals that a predator like the Red-tailed Hawk would make use of. Being able to adjust its habitat, foraging, location, nesting, and diet is the main reason the Red-tailed Hawk is actually increasing in world population.
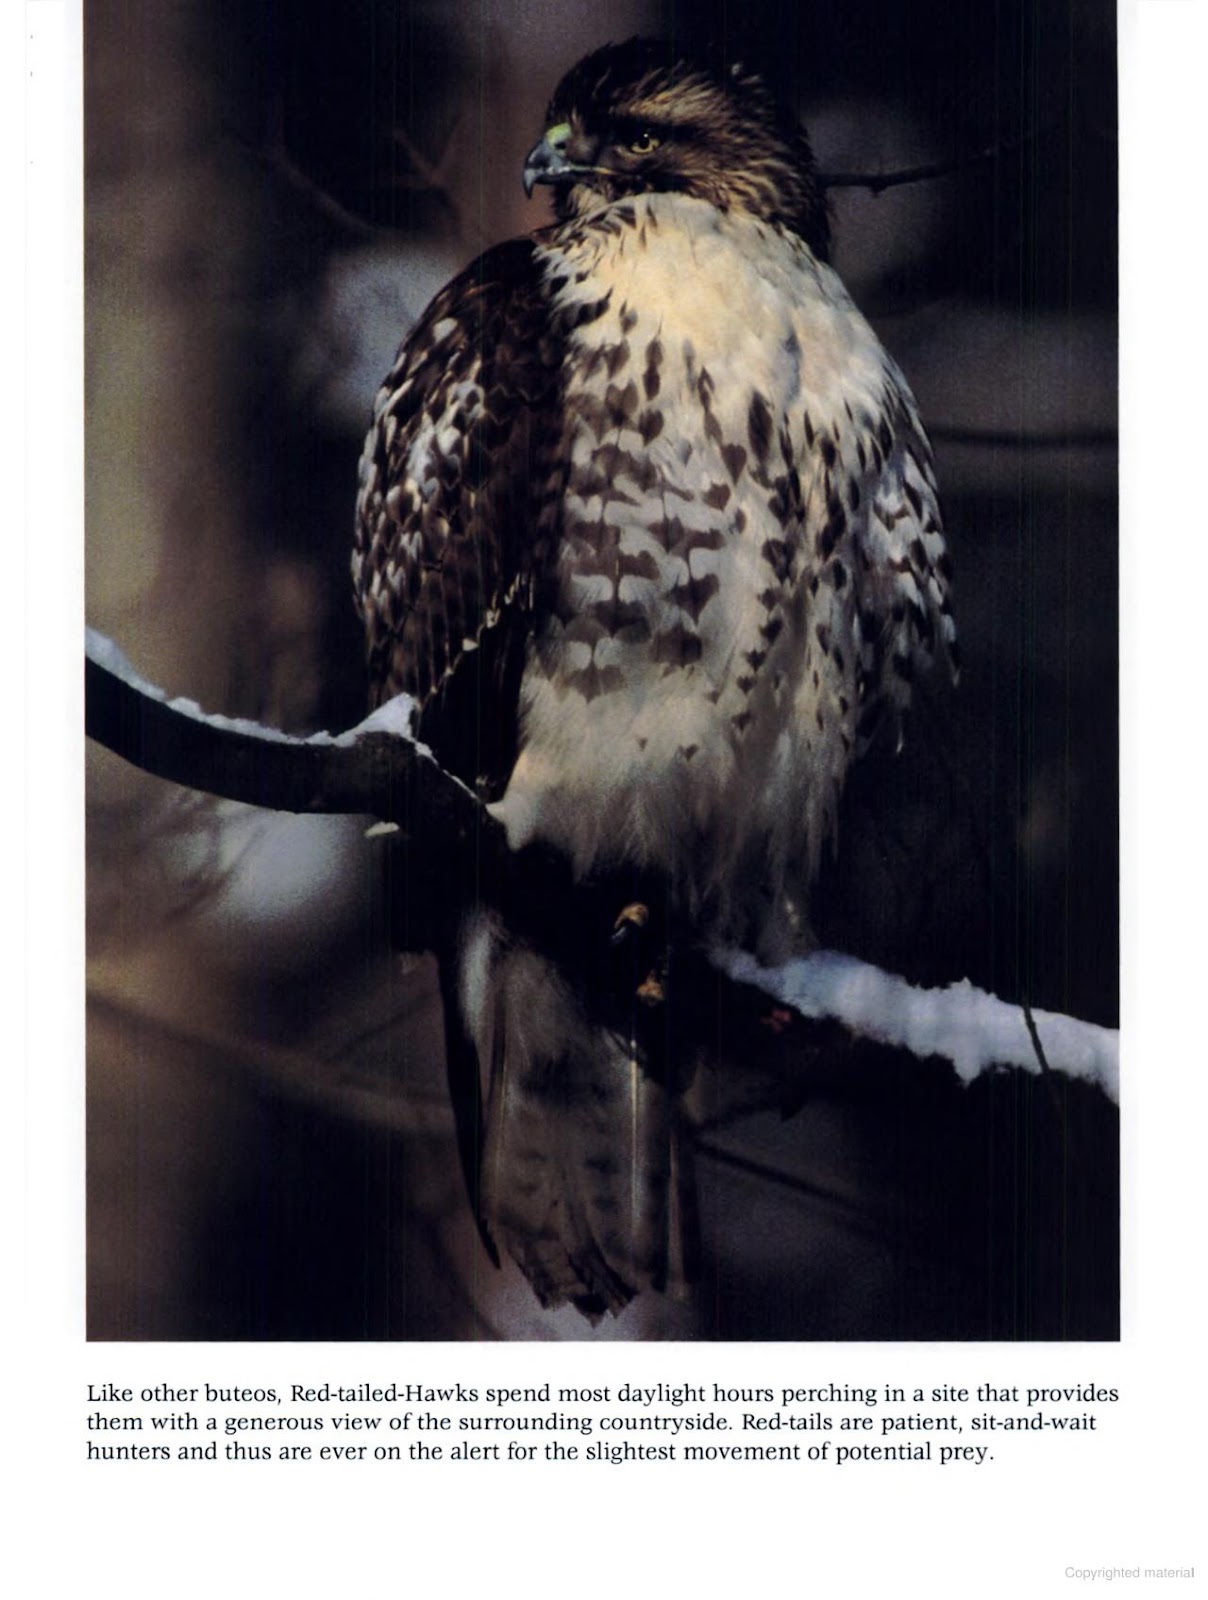
Figure 4. Charles R. Preston book “Red-tailed Hawk”, a perched Red-tailed Hawk.
5. The Importance of this project:
The importance of the PPR and its avian wildlife revolves around its ecologically valuable freshwater resources. The wetlands provide abundant ecosystem services, including flood control, groundwater recharge, water for agriculture, water purification, and recreation (climatehotmap.org). Warming temperatures threaten the entire region and the vital ecosystems it supports. Hotter weather dries up the wetlands more quickly unless accompanied by an increase in precipitation.
The western part of the PPR in the U.S. has become dryer during the twentieth century, while the eastern become wetter (climatehotmap.org). Despite the wetter condition in the eastern sections of the PPR, many wetlands have been drained and developed for agriculture. This decreases their potential to compensate for habitat losses in western sections struggling with a drier, hotter climate (climatehotmap.org). Wetland drainage occurs when smaller wetlands are drained into one larger wetland. This is unhealthy for avian wildlife populations, by creating competition, increasing predator population, and disease.
6. Research Questions:
With this project we will analyze large eBird data sets from Cornell University Lab of Ornithology using the Python language to investigate:
A. How many bird species and which species use the PPR.
B. How and when specific birds are using the PPR.
Methods
1. Data Introduction and Slimming:
This project focused on data requested from eBird.org managed by the Cornell University Lab of Ornithology. Data is submitted from around the world with more than 100 million annual observations. Bird observations for the 5 U.S. states encompassing the PPR (Montana, North Dakota, Minnesota, South Dakota, and Iowa) were requested and access was granted. The data files were initially too large to work with in the Google CoLaboratory environment. Therefore, the data was slimmed down to make it manageable. The original text files were broken into smaller text files of under 2 million records using Notepad ++. The data was then read into Microsoft Access and slimmed to include just the observations in the PPR. Finally, the data was exported into individual files for each state and then put together into a single file using Notepad++.
Originally, we were going to integrate this data with methane flux data for this region, which was only available for the U.S. states of the PPR. This, and size of datasets, is why we limited our data to the 5 U.S. states.
2. Number of unique birds in the PPR:
Determining the number of unique birds that use the PPR was a first step in order for us to choose which birds to focus our study. Figures 5 and 6 show the Python coding that was used to obtain an alphabetized list of the unique birds observed in this region and the number of unique birds, respectively.
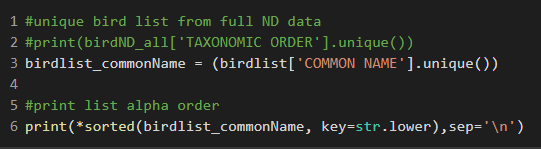
Figure 5. Python code for list of unique birds observed in the PPR.
Figure 6. Python code for the number of unique birds observed in the PPR.
3. Unique observers in PPR bird observations:
The number of unique observers that contributed to this dataset was determined by grouping the Observation year with the Observer ID and plotting the resulting column of number of unique observer IDs per year, as seen in Figure 7.
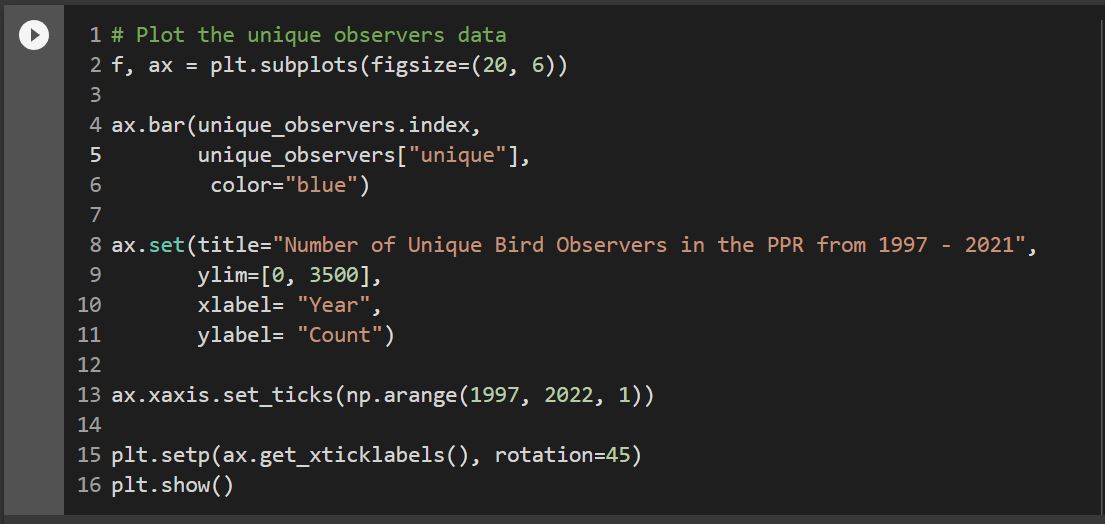
Figure 7. Matplotlib Plotting Code for Unique Bird Observers.
4. Mapping of Bird observations in the PPR:
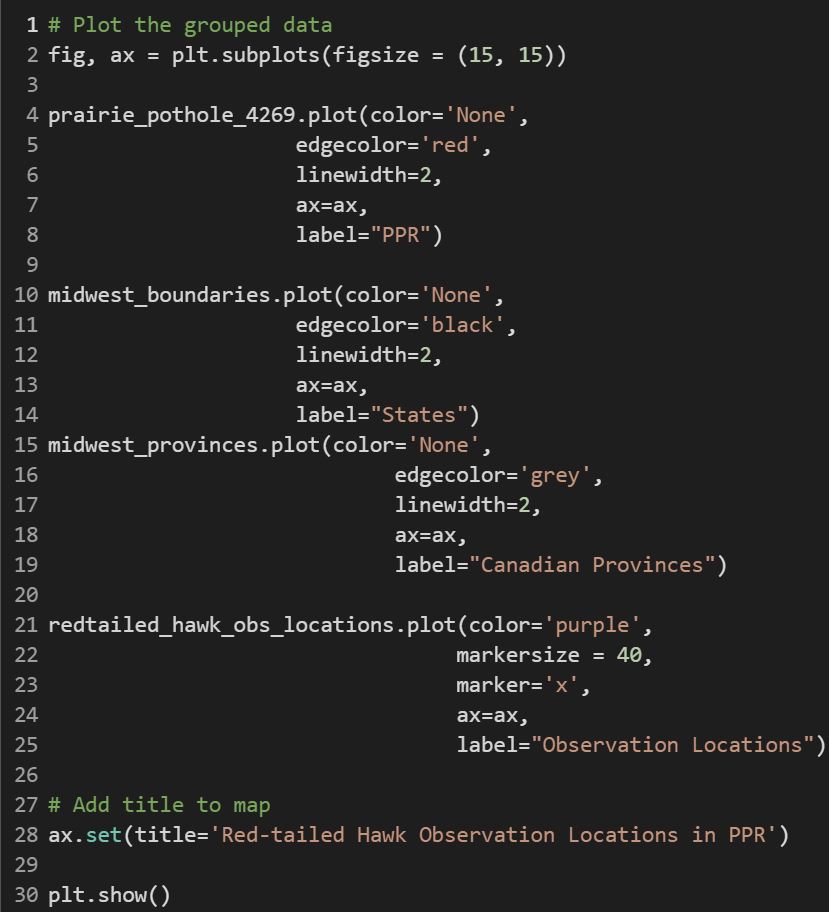
It is important to visualize where the selected birds are being observed within our region of study. To do this, shapefiles for selected U.S. states and Canadian provinces, along with a shapefile of the Prairie Pothole Region were overlaid into a map. Then, recorded latitude and longitude for each observation of our birds of interest were plotted on the map to show where each recorded observation was made from 1997 to 2021. Figure 8 shows the shapefiles and plotting code of recorded observations using Python in Google CoLaboratory.
Figure 8. Example mapping code for Red-tailed Hawk observations in the PPR.

5. Bird Behavior Observations By Year in PPR:
Bird observations by year were determined by grouping observation count, behavior codes, and observation years. The resulting categorical data by observation year was then plotted using a stacked bar chart (Figure 9).
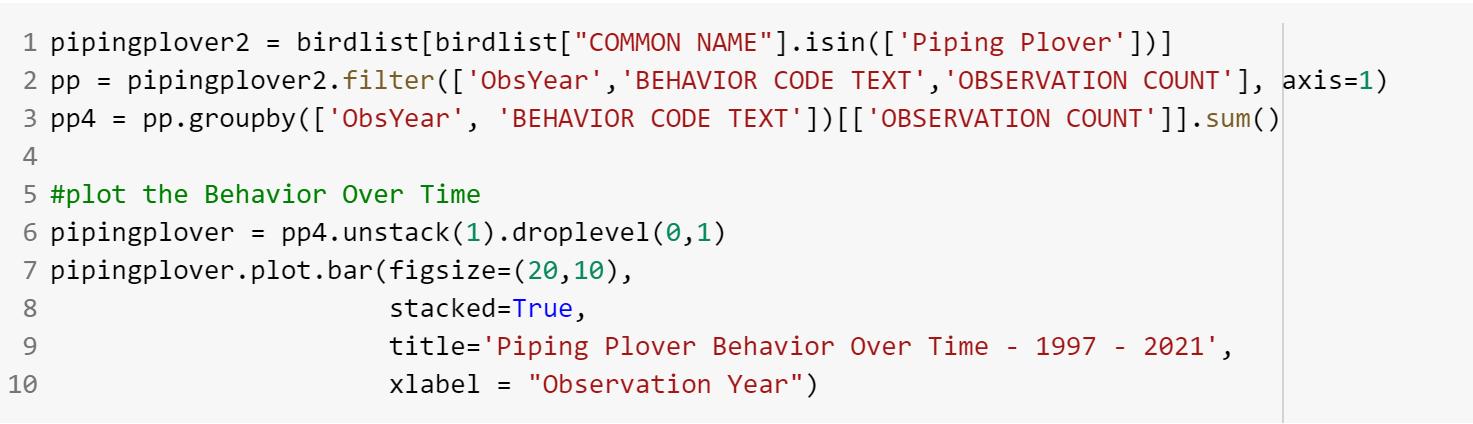
Figure 9. Plotting code for stacked behavior bar plot.
6. Selected Bird Behavior Observations Over Time in the PPR:
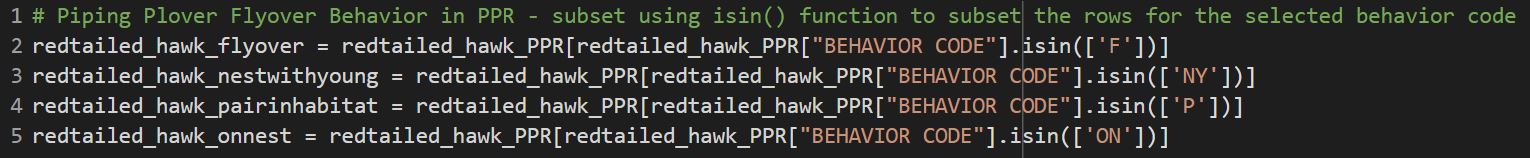
Behaviors were subset by selecting the 4 most observed behaviors for each bird using the .isin() function as seen in Figure 10. Plots of all observed behaviors by year were used to determine which behaviors occurred most often. Once behaviors were subset, matplotlib was used to create a scatter plot showing selected behaviors by observation date.
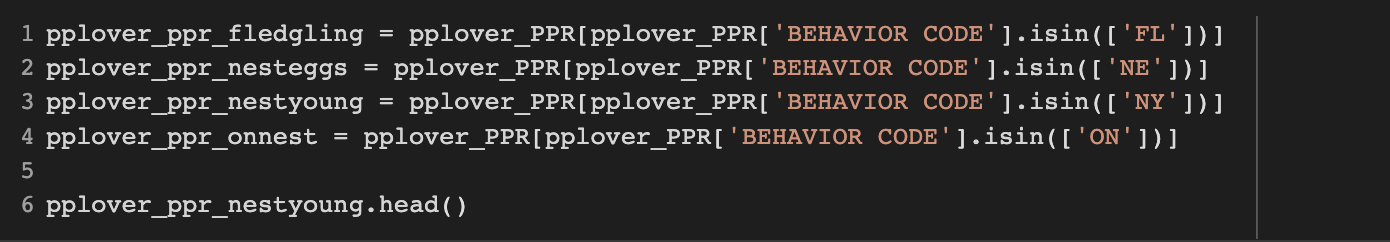
Figure 10. Subsetting code for behavior observations over time.
Results
1. Number of unique birds in the PPR:
The number of unique birds observed in the PPR helped in narrowing down birds to focus on for this study. When the data was expanded to include the years 2017 - 2021, the number of unique birds observed increased by nearly 60 species to 665 (Figure 11). This supports the importance of this region to several hundred species, of which some, like the piping plover, may have limited alternative habitats to live.
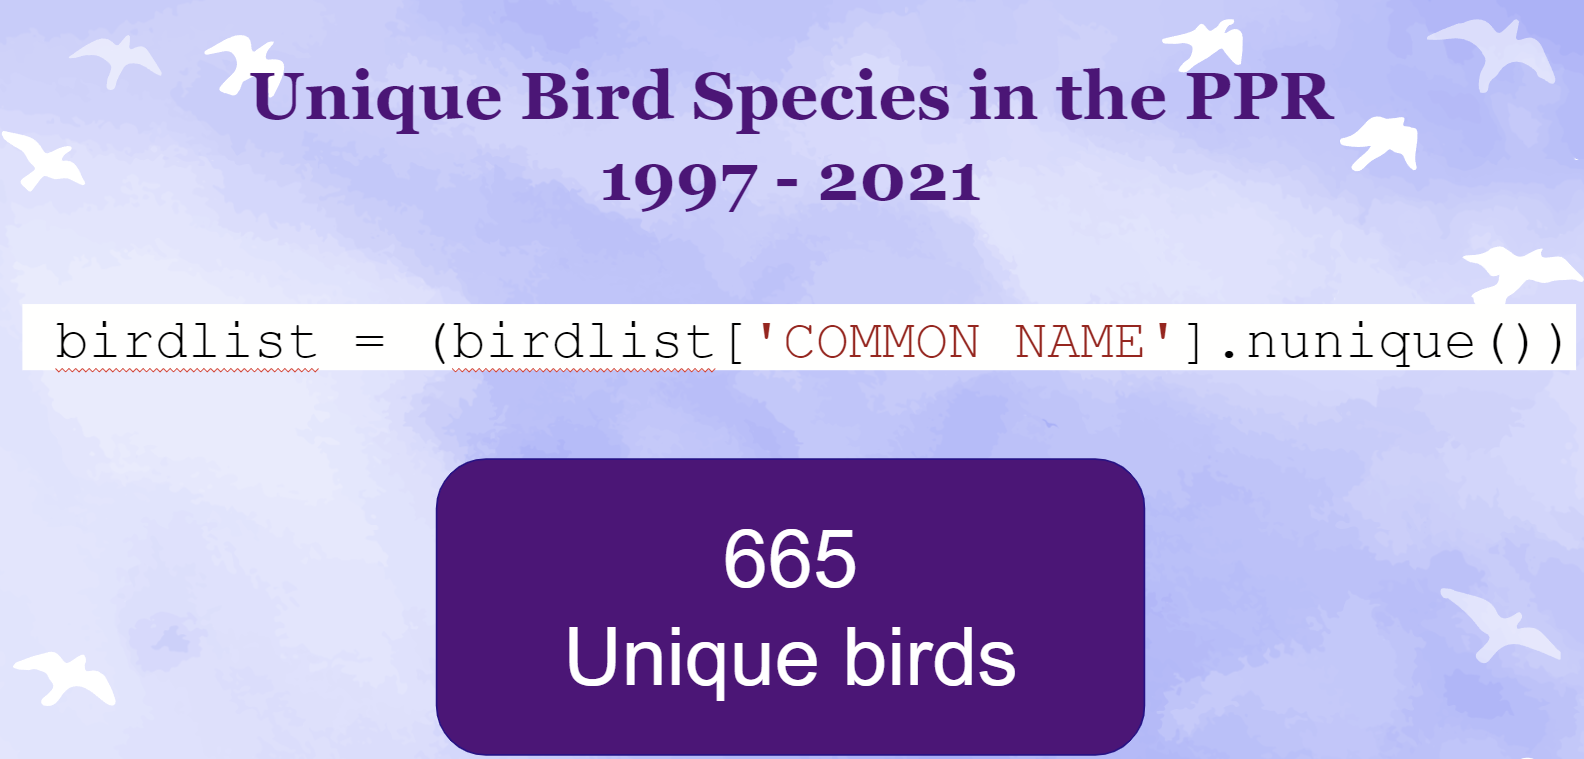
Figure 11. Unique birds in PPR.
2. Unique observers in PPR bird observations:
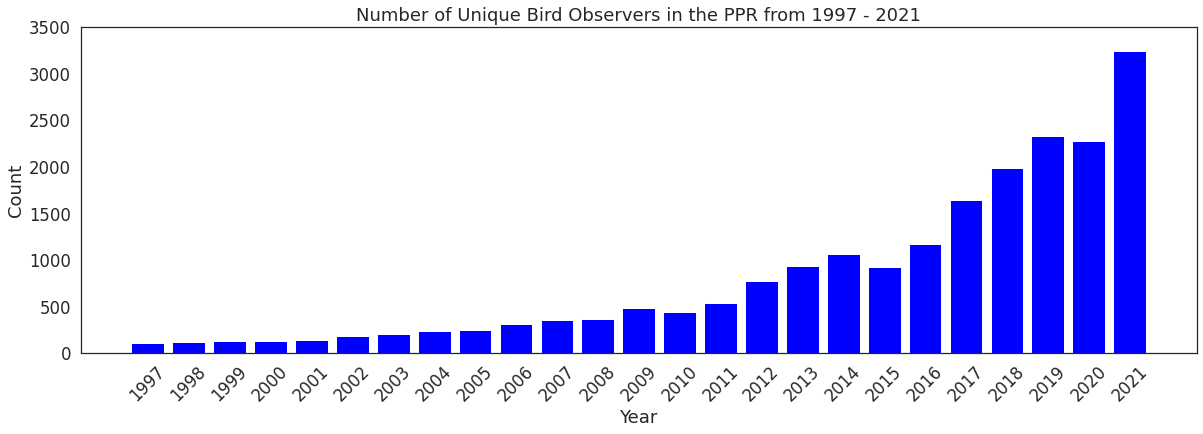
As the eBird project took off and they got the word out about it, more community engagement occurred which impacted the number of unique observers. The plot in figure 11 shows that there is an increasing number of unique observers, especially after 2011.
Figure 11. Number of unique observers from 1997 - 2021.
3. Map of bird observations in PPR:
The bird observations used for this study are recorded through the eBird project and contain data for where they have been observed. The data was subset to a specific region of the world and by mapping where those observations occurred, we can see the distribution of observations in this region. It appears that the piping plover is less frequently observed; however, they do appear to be observed throughout the U.S. portion of the PPR (Figure 12). Being a small endangered shorebird, their observations are likely limited to smaller portions of the larger region that have optimal breeding habitat.
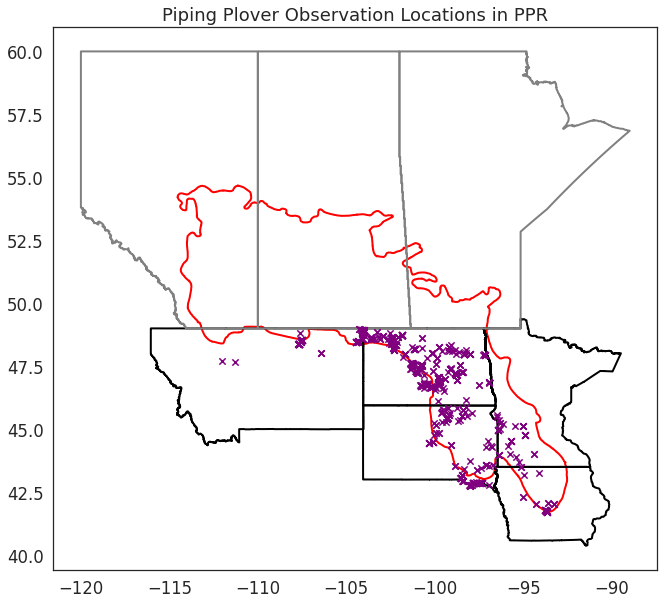
Figure 12: Piping plover observations from 1997-2021.
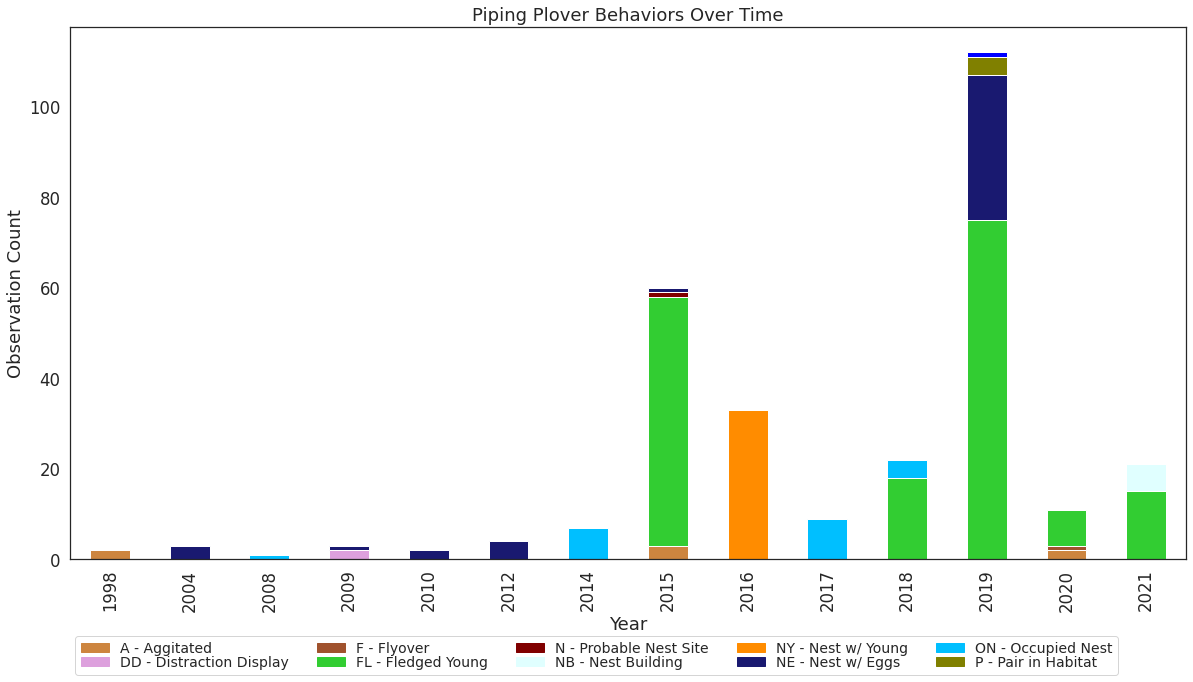
4. Bird Behavior Observations By Year in PPR:
Figure 14 and 15 show the behaviors of the piping plover and red-tailed hawk, respectively, by year. These are all of the recorded behaviors from 1997-2021 in a stacked bar plot. 2015 marked an increase in observed behaviors for the piping plover with the most behaviors recorded in 2019 (Figure 14). Recently fledged young appeared to be the most observed behavior, followed by nest with eggs, nest with young, and occupied nests. They nest in shallow nests dug into shorelines so this behavior may be easiest to observe. Behaviors were not recorded from 1999 - 2003, 2005 - 2007, 2011, and 2013 possibly due to low total numbers of observations during those years.
Figure 14. Piping plover behavior observations per year.
1. The red-tailed hawk had few behavior observations until 2013 when there was a fairly steady increase in behaviors, with a drop in 2018 and 2019 but a strong recovery in 2020 and 2021 (Figure 15). Occupied nest, flyover, nest with young, and pair in suitable habitat were the most observed behaviors for the red-tailed hawk. These behaviors support how the red-tailed hawk has been described to use the wetlands in this region as hunting grounds.
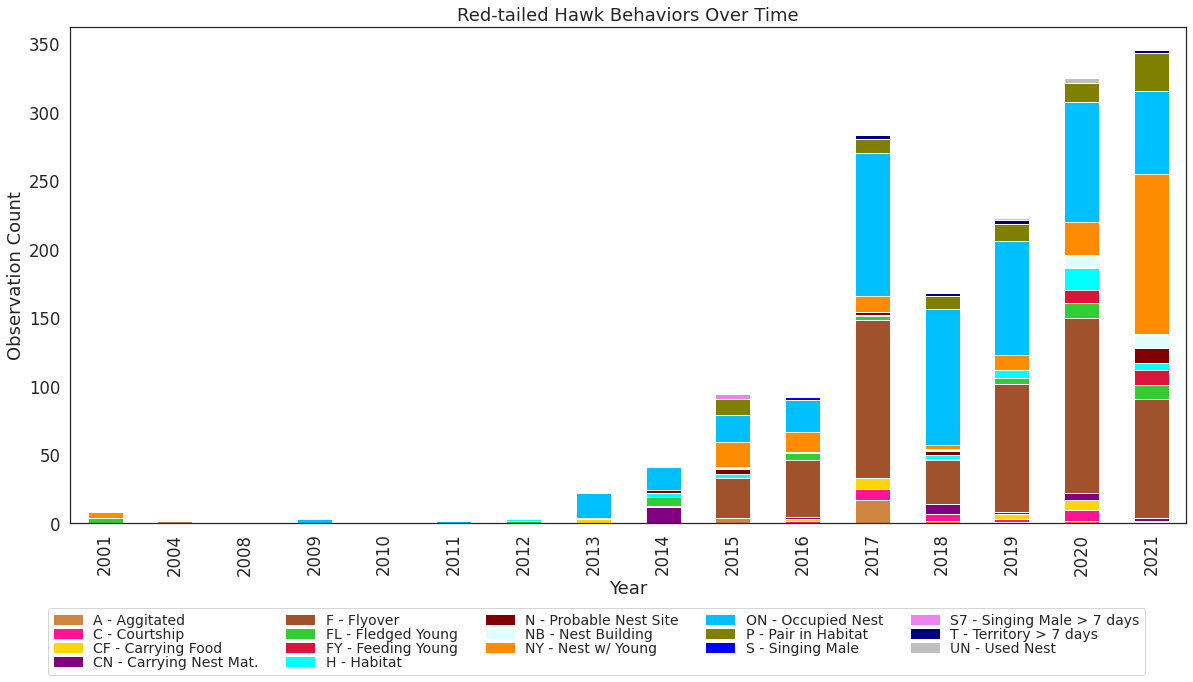
Figure 15. Red-tailed hawk behavior observations per year.
5. Selected Bird Behavior Observations Over Time in the PPR:
Figures 16 and 17 show the four most prevalent behaviors over time for the piping plover and red-tailed hawk, respectively. Subsetting the most active behaviors for each species and plotting it over time allowed for exploration into when these behaviors were being observed in this region during the year. Piping plover recently fledged young appear in April - May with nest with eggs and occupied nests being observed just prior in March - April (Figure 16). The red-tailed hawk showed occupied nests anywhere from October to February with nests with young at the same time and/or immediately after (Figure 17). Flyovers seem to appear throughout the summer, especially in later years.
Figure 16. Piping plover four most prevalent behaviors over time.
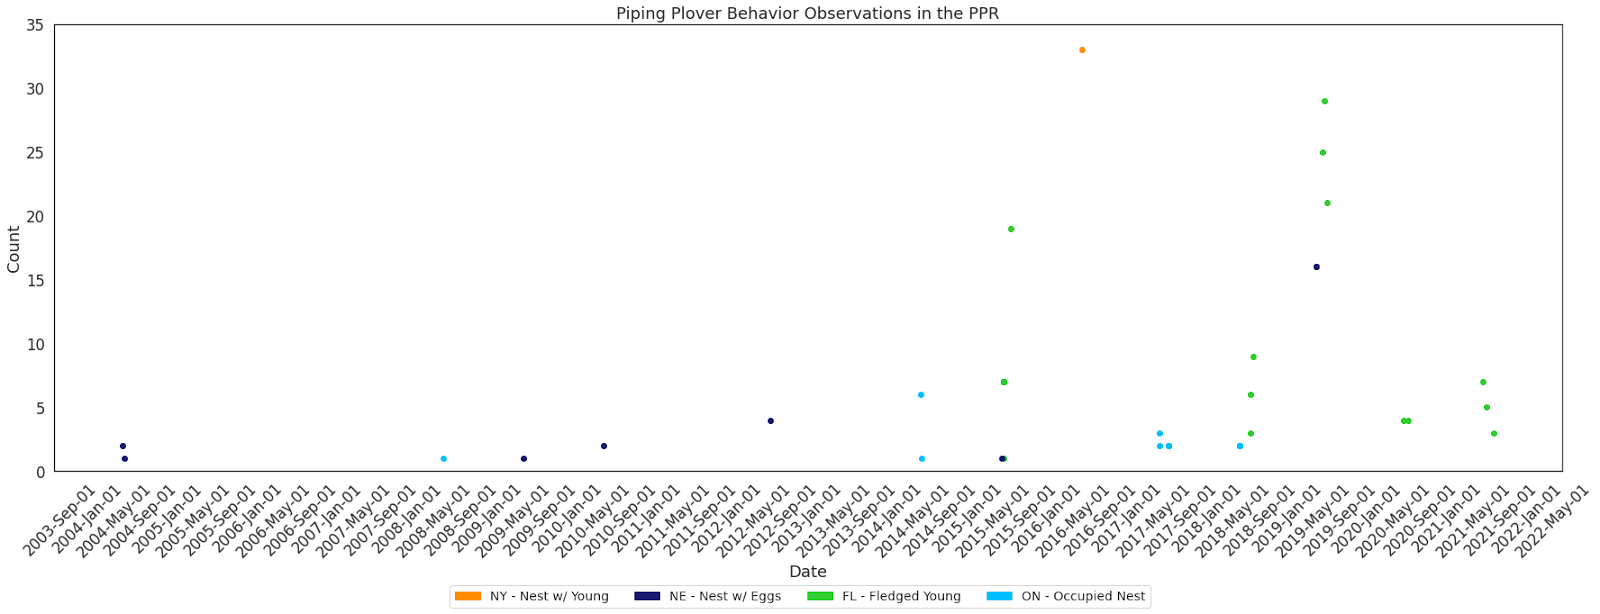
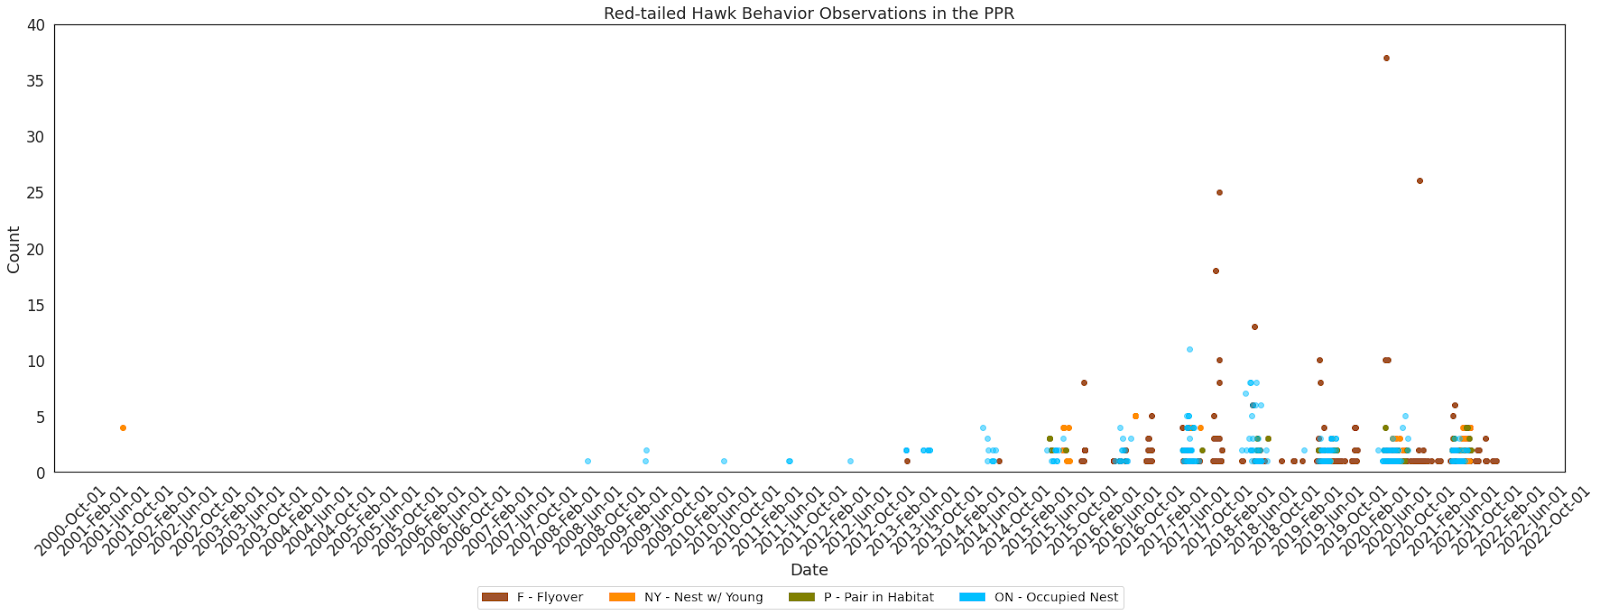
Figure 17. Red-tailed hawk, four most prevalent behaviors over time.
Discussion
This project used bird observation data gathered by scientists and community observers to investigate relevant bird behaviors within the U.S. portion of the Prairie Pothole Region. The Google CoLaboratory environment allowed us to subset, plot, and map various visualizations representing the massive amount of data using the Python coding language.
The initial goal of the project was to integrate two datasets to investigate whether differences in water depth over time impacted bird behavior in the critical PPR. However, there was a lack of confidence in whether the bird observations actually occurred on the wetland where water depth was measured, due to differences in latitude/longitude records. Therefore, the project goals shifted and narrowed to examine behaviors of specific birds in this region.
First, within this dataset, there were 665 unique species of birds observed in the U.S. portion of the PPR. This expanded from 607 when the years 2017 - 2021 were included in the analysis. This, along with the sheer amount of observations, led to the question of how many unique people contributed to this data each year. We found a steady increase in unique observers from 2002 to 2020 with a substantial increase in 2021. With internet popularity and social media platforms, projects like the eBird project can grow quickly. Community engagement can be critical in guiding more in-depth research studies by agencies and labs to learn more about birds and their behaviors in specific locations.
Bird behavior is a good measure of the health of the ecosystem and of the bird population. The behaviors observed for both the piping plover and red-tailed hawk were not unexpected; however, the limited total number of recorded behaviors for each bird was unexpected. The red-tailed hawk had more recorded behaviors than the piping plover but both accounted for a small percentage of the total respective bird observations. It is likely that specific labs and agencies are conducting studies and know which behaviors to record. These labs and agencies represent a limited number of the unique observers contributing to the larger eBird project ultimately limiting the total number of recorded behaviors. Providing education and awareness about bird behaviors may increase the number of recorded behaviors and help further guide downstream research. For example, the next steps for our small study include investigating the impacts of drought in the PPR on relevant bird species using this region. With the growth in the amount of data recorded in the datasets used for this study over time and the increase in the number of unique observers, we are confident that community engagement with the larger eBird project is providing valuable data that can be used in conservation, management, and sustainability of species.