Forest Recovery: Post-wildfire vegetation analysis after Chimney Tops 2 Fire
Post-wildfire vegetation regrowth analysis after the Chimney Tops 2 Fire in Great Smoky Mountains National Park
Author: Stepan Bryleev (CU Boulder EarthLab student)
Industry supervisor: Bridget M. Hass (NEON Remote Sensing Data Scientist)
University supervisor: Dr. Elsa Culler (CU Boulder EarthLab Teacher)
Industry supervisor: Bridget M. Hass (NEON Remote Sensing Data Scientist)
University supervisor: Dr. Elsa Culler (CU Boulder EarthLab Teacher)
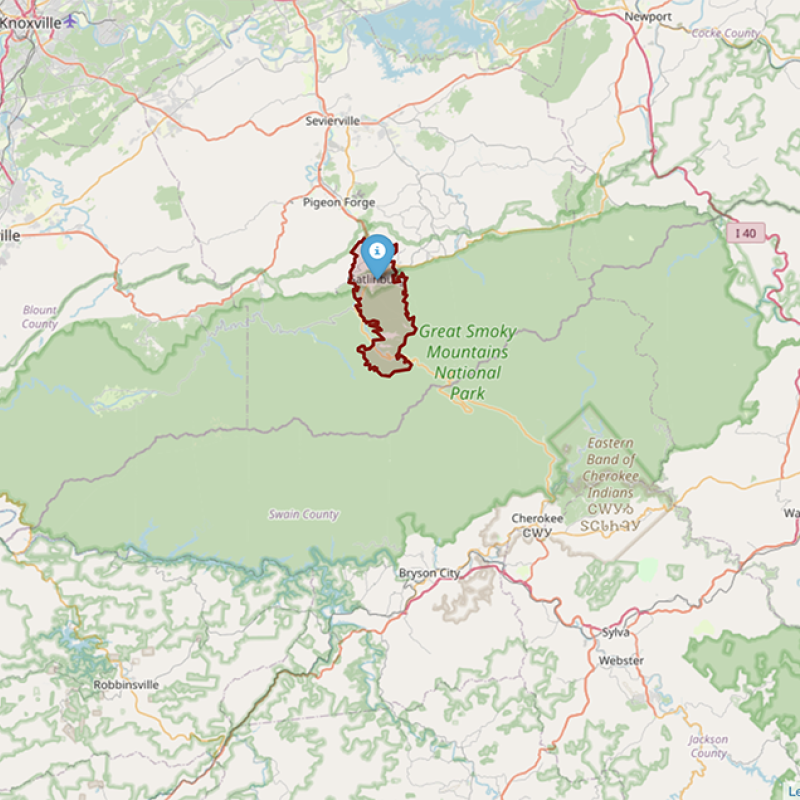
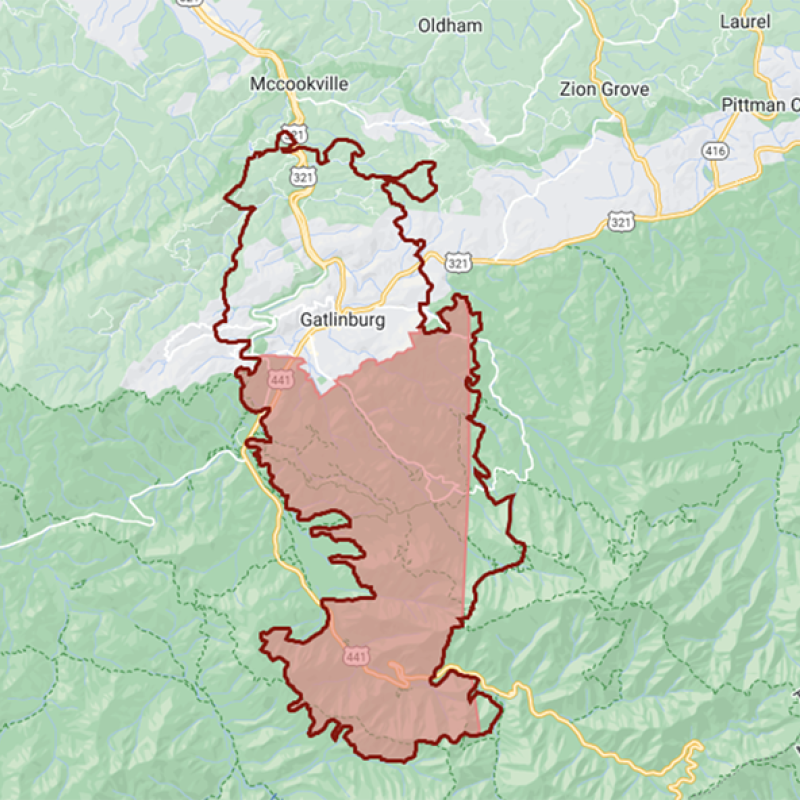
Figure 1. The map of the Great Smokey Mountains National Park and Chimney Tops 2 Fire Boundary.
The blue marker denotes the city of Gatlinburg, TN.
Results
Forest Canopy Height
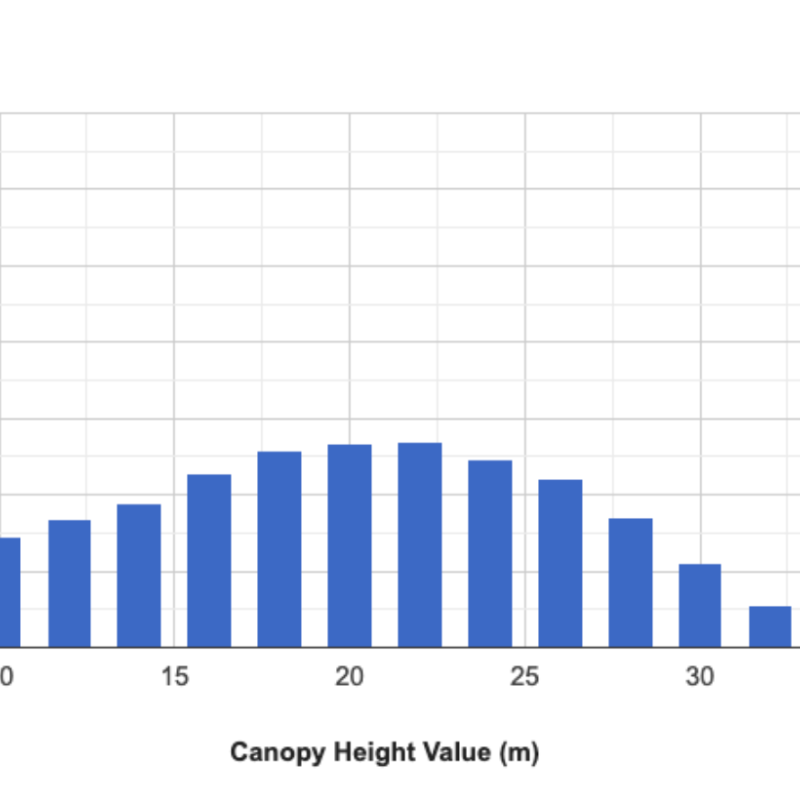
First let's look at high resolution Canopy Height Models of difference (dCHMs) calculated using NEON Lidar data to estimate canopy height difference.

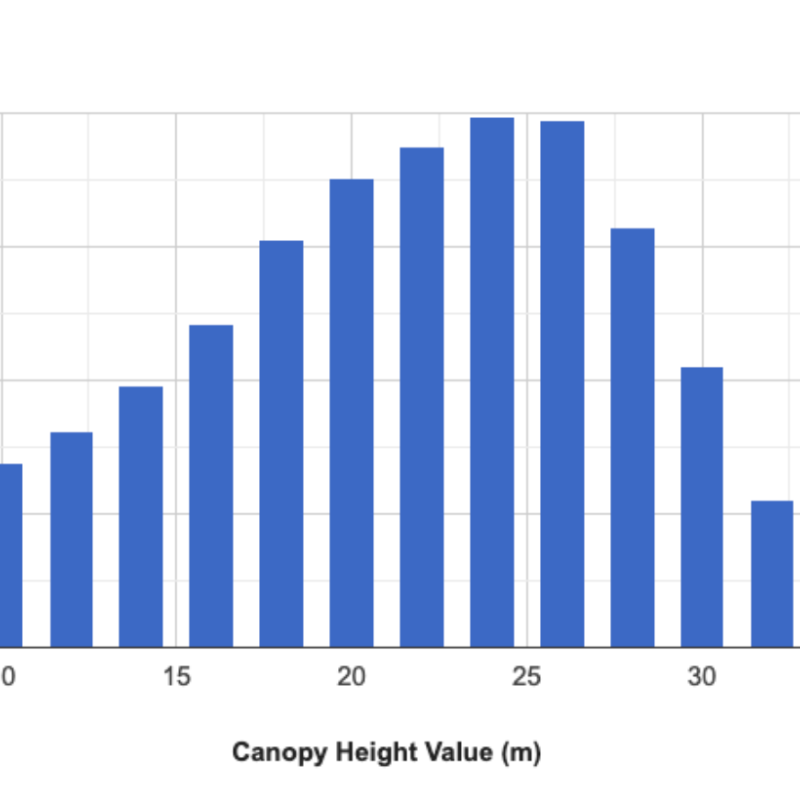
Histogram 1. Histogram of 2016 canopy height distribution inside the GRSM study area (from NEON Lidar data).
What about regrowth?
Now let's look at the forest recovery for the period from 2017 to 2021.
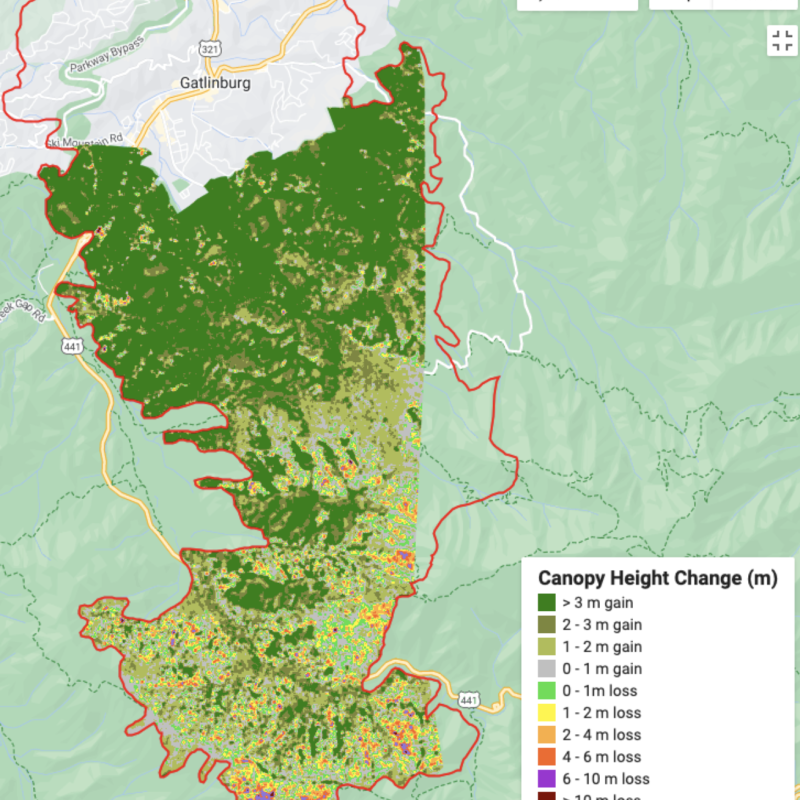
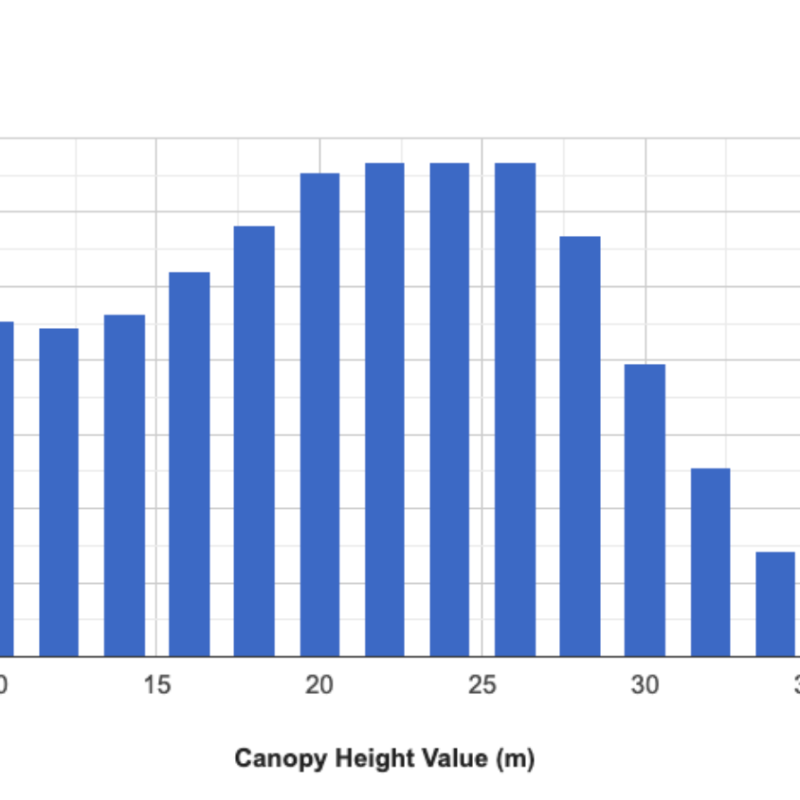
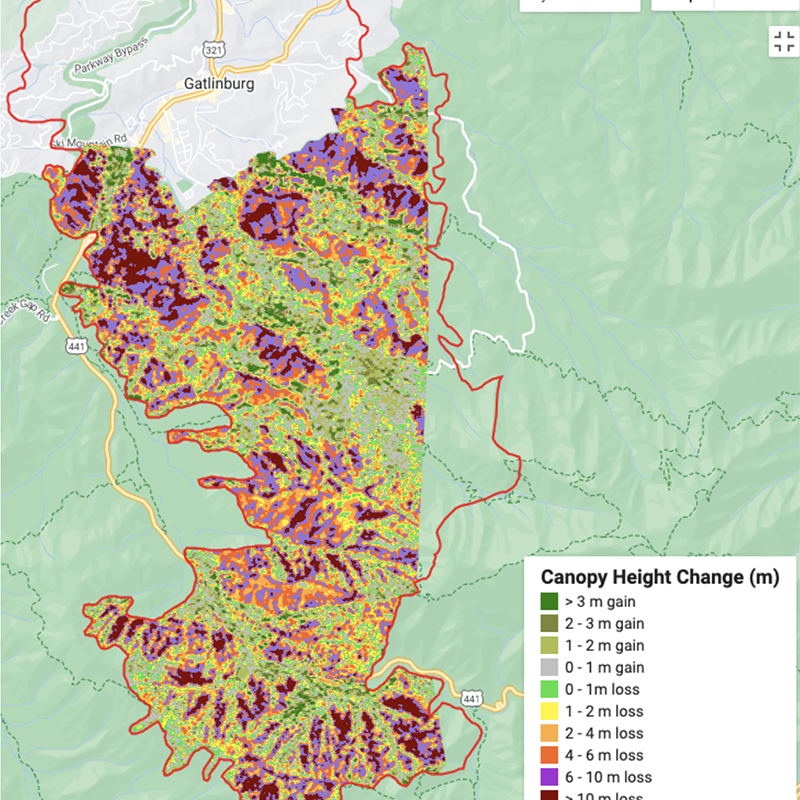
Figure 5. dCHM between 2016 and 2021 for GRSM study area (height difference in meters).
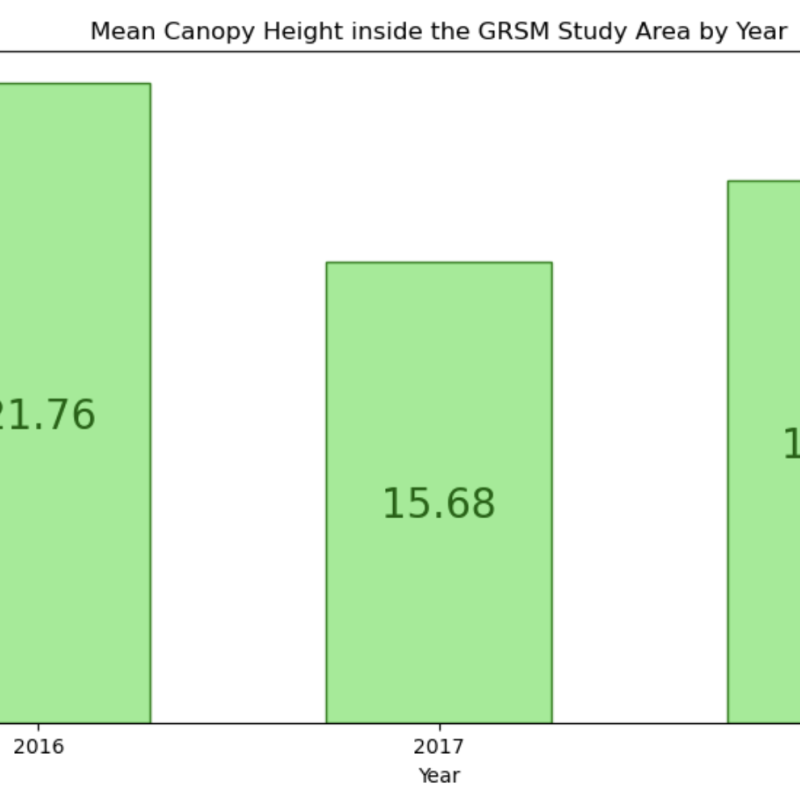
Mean Canopy Height by year
Generally, the following values of the mean canopy height were obtained from the NEON Lidar data for 2016, 2017 and 2021 (Figure 6).
Vegetation Indices
a. NEON reflectance data
Now let's look at reflectance data and vegetation indices. dNBR Image between 2016 and 2017 for NEON data (Figure 7) shows that fire impact on the forest ecosystem was substantial. Many areas affected by fire can be assigned to moderate or high fire severity classes according to United Nations SPIDER burn severity mapping recommendations.
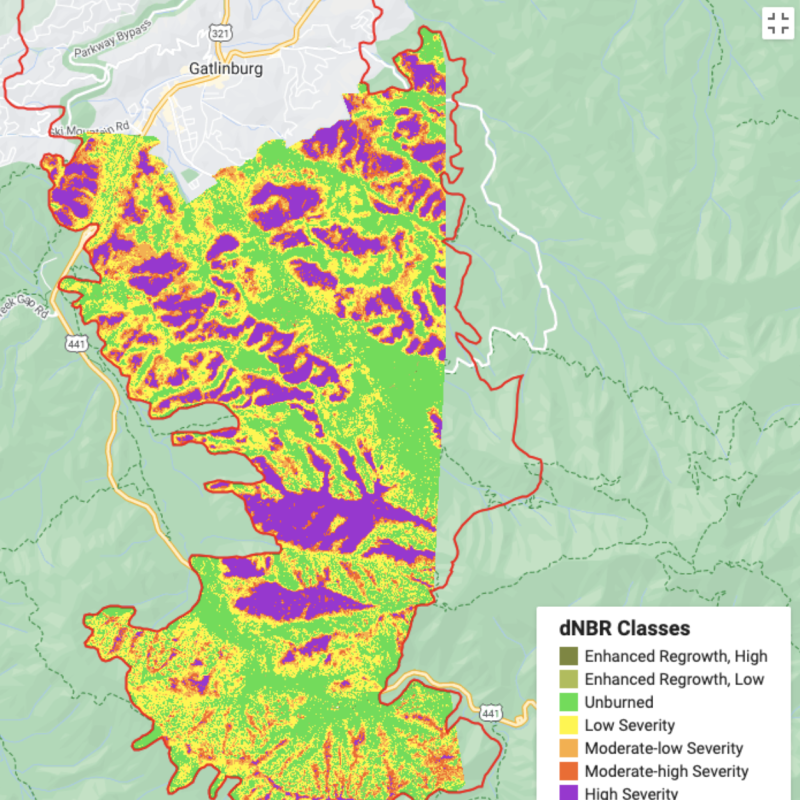
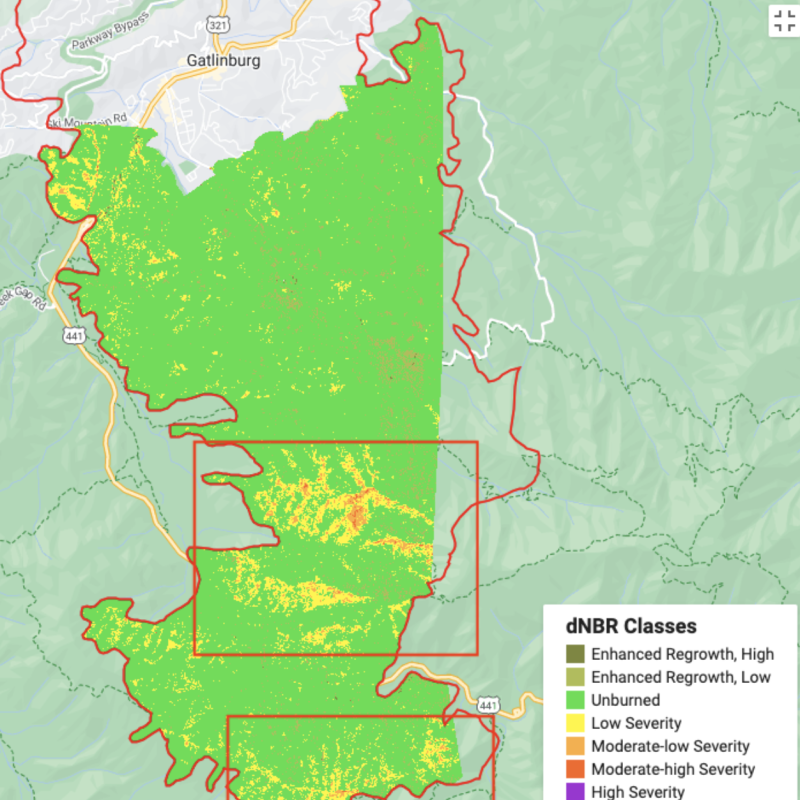
Figure 8. NEON data, dNBR between 2016 and 2021 for GRSM Study area. Red rectangles denote zones of slow post-fire recovery.
b. Landsat 8 reflectance data
The temporal data coverage provided by Landsat 8 allowed us to use the most recent observation data from 2023. So let’s have a look at the Landsat data from 2015 to 2023.
The dNBR image between 2015 and 2017 (Figure 9) shows similar patterns to what we saw with the NEON data (Figure 7) for the first year after the fire.
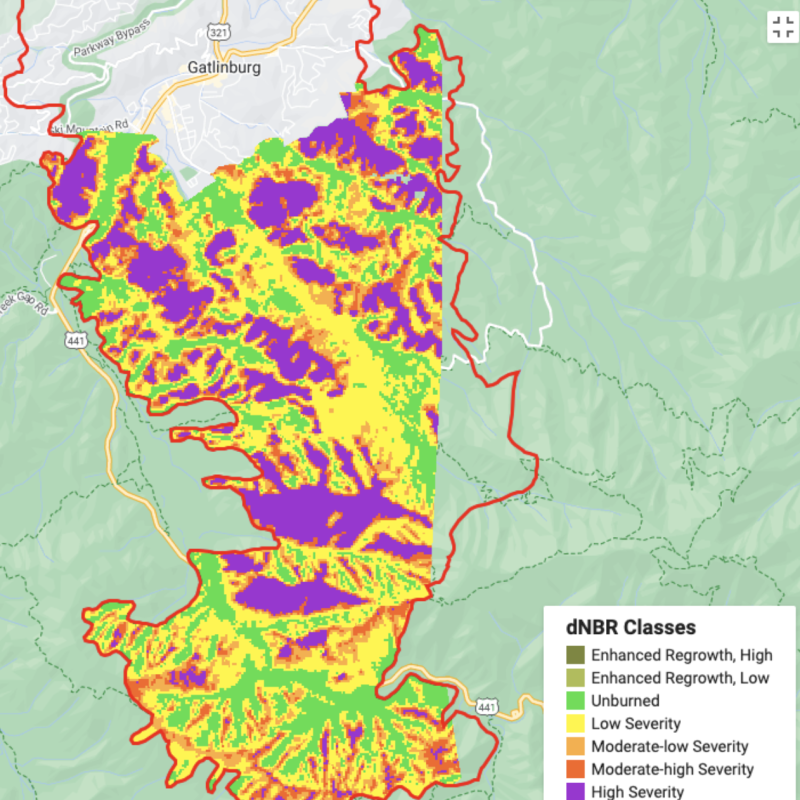
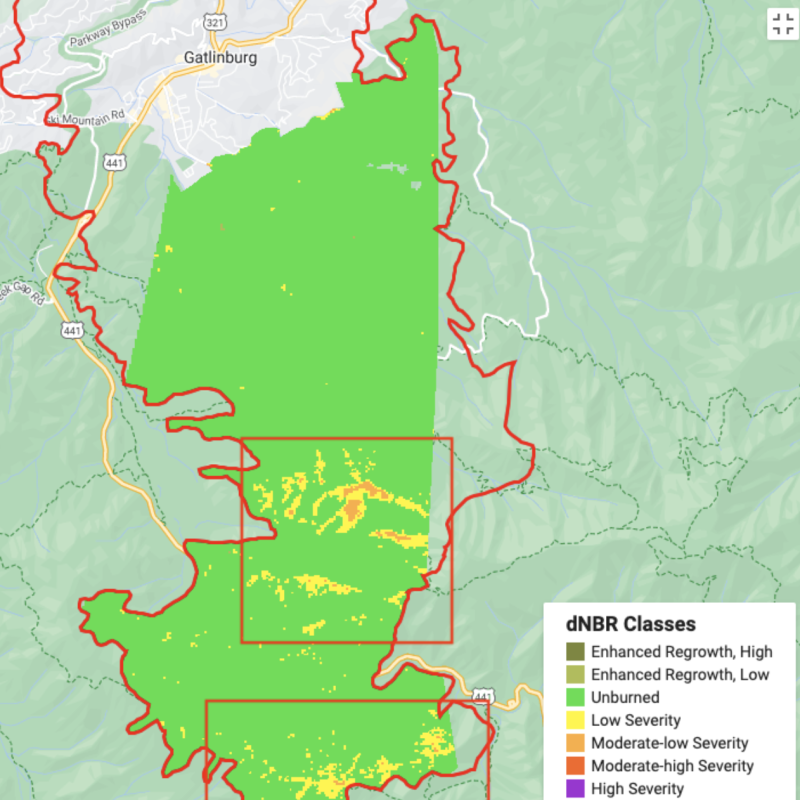
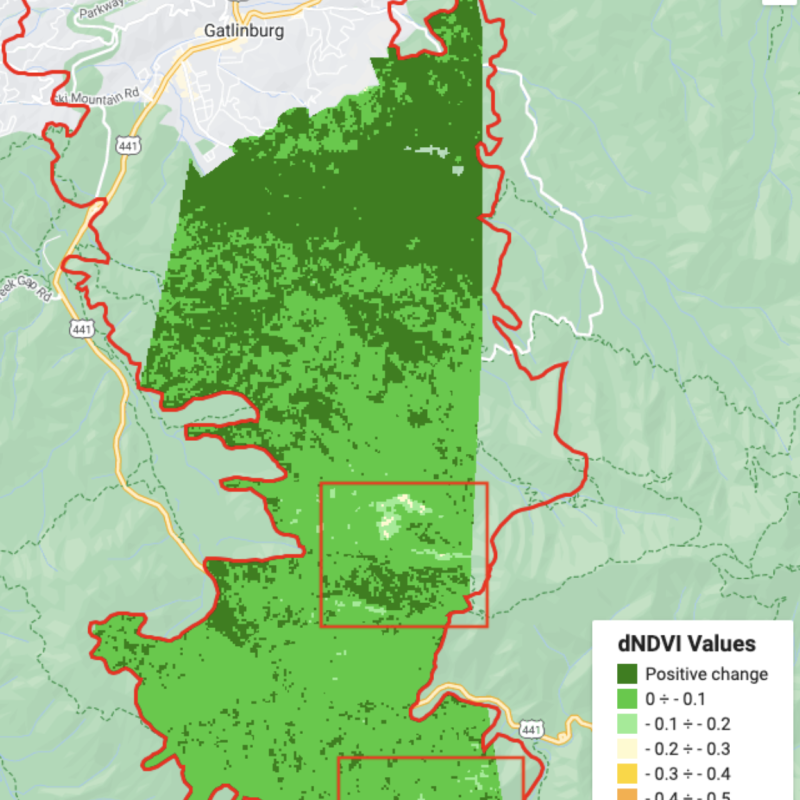
Figure 11. Landsat 8 data, dNDVI between 2015 and 2023 for GRSM Study area. Red rectangles denote zones of slower post-fire recovery.
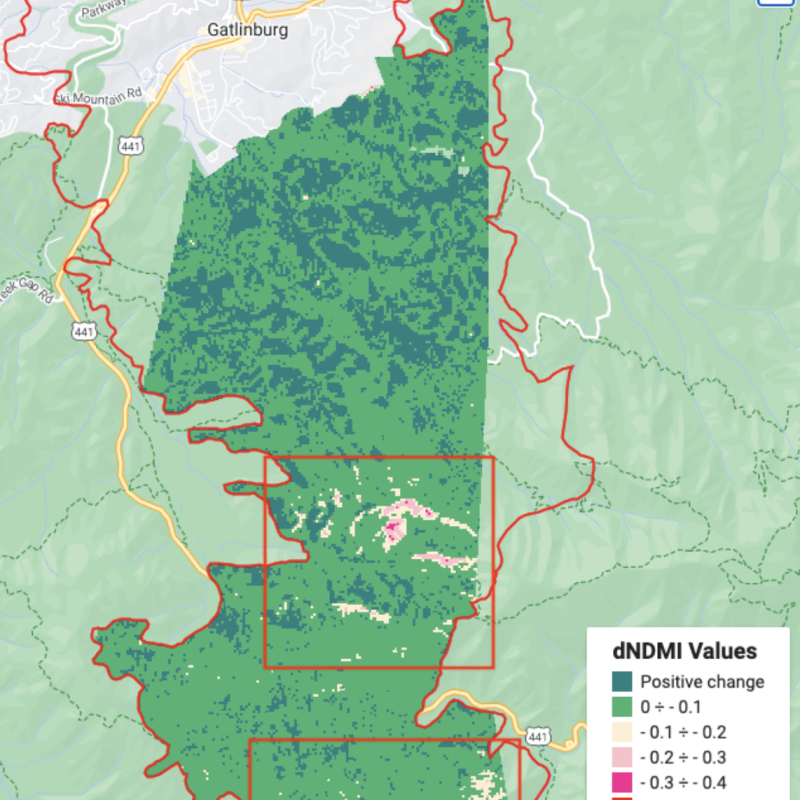
Figure 12. Landsat 8 data, dNDMI between 2015 and 2023 for GRSM Study area. Red rectangles denote zones of slower post-fire recovery.
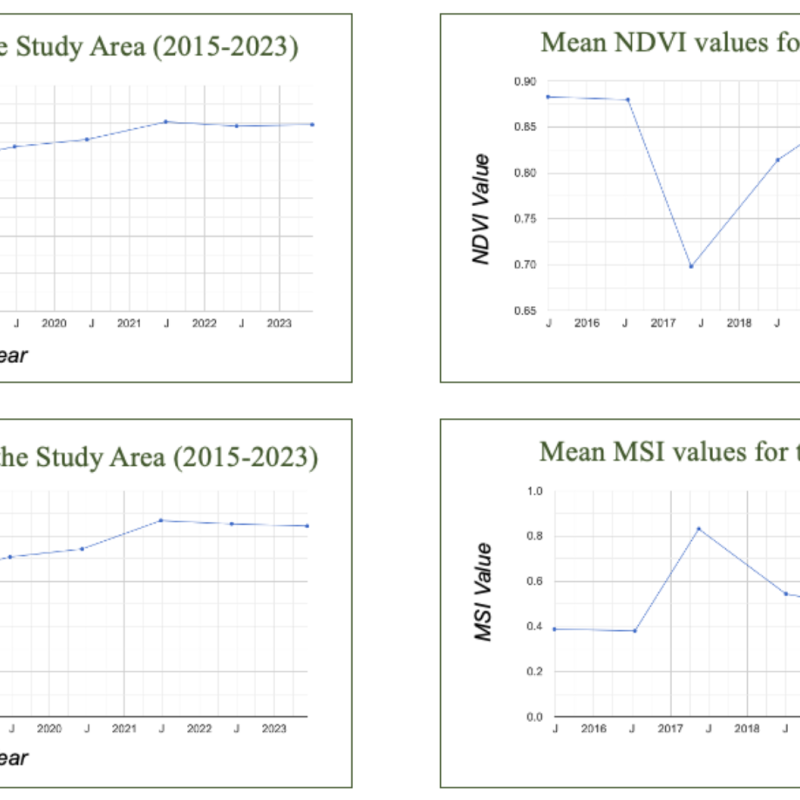
Time series charts of vegetation indices
Time series of the annual vegetation indices mean values also show the impact of the fire event as well as the post-fire recovery progression (Figure 13).