The Problem of Defining Drought
“The problem of defining drought… has never been resolved to the satisfaction of all. ” -Kelly Redmond
The term "drought", like the term "the economy", is understood to affect most of the world's population yet a comprehensive definition is elusive. At the simplest level, drought occurs when water loss in an area exceeds water inflow in an area. Even this definition is flawed, however, since drought status changes based on the size of the area assayed. That is, a droughted area may lie unconnected to but within eyesight of an area with adequate water supplies.
Despite the slippery definition, it is clear that droughts are becoming more intense as climate change affects long-standing weather patterns. Predicting droughts is likewise becoming more difficult. In the western United States, for example, snowpack is used to help predict droughts, but as snowpack decreases in a changing climate so does the accuracy of drought predictions.
Many of drought's impacts lie "downstream", both figuratively and literally. As water supplies diminish, crops are not adequately irrigated; food insecurity and health both decline, and civil strife may follow. In North America, droughts are often inconveniences to our standards of living: we can no longer fill our pools and must water our lawns less frequently - so far. The developing world bears a disproportionate burden during drought conditions.
We should care about drought since it is a "foundational problem": a drought leads to ripples that radiate (often unpredictably) across different but linked issues: from crop production to quality of life. Drought itself may be a given, but our reaction to it is not. We can ask ourselves: what can we learn about drought that can lead to actionable steps to moderate its impact? By answering this, we can point towards managing the effects of climate change worldwide.
Methods: Preliminary Data Exploration
- Select study area based on combination objective/subjective measurement
- Chart drought status for 1 calendar year
- Use P/PET, a measure of crop stress, to quantify drought trends
- Look at daily values across April
- Historical norms from Aprils 2010-2019
- This year's daily quantities
- Look at average accumulations in April
- Historical accumulations from April 2010-2019
- This year's daily accumulations in April
- Using aWhere's API, map P/PET values across study area
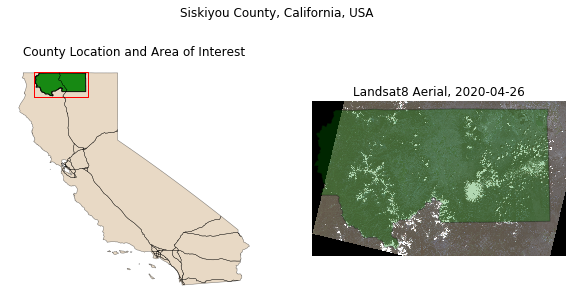
- Over 60% of Siskiyou County by area is in a state of "extreme drought" according to the U.S. Drought Monitor as of April 2020.
- Siskiyou County also relies on water availability for agriculture, making it a candidate for further analysis.
- California's large population and agricultural productivity mean that droughts lead to major impacts in this state.
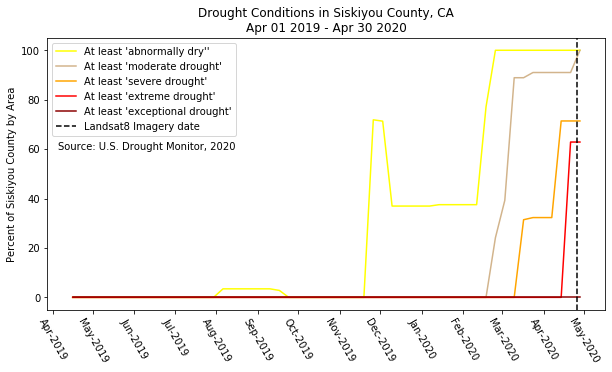
The U.S. Drought Monitor provides a drought index available at the county, state, and regional level for the United States. Government agencies such as the Farm Service Agency and the Internal Revenue Service depend on its accuracy, so it is an ideal source to start data exploration. The drought index is unique as it combines quantitative data (such as from the Standard Percipitation Index) with qualitative evaluation from experts. From these results, at least 50% of the county has been in a state of moderate drought since early March 2020. This plot was used to justify selection of Siskiyou County as this project's area of interest.
Simplified Workflow
- Download csv data
- Load into dataframe
- Format datetime to plot legibly
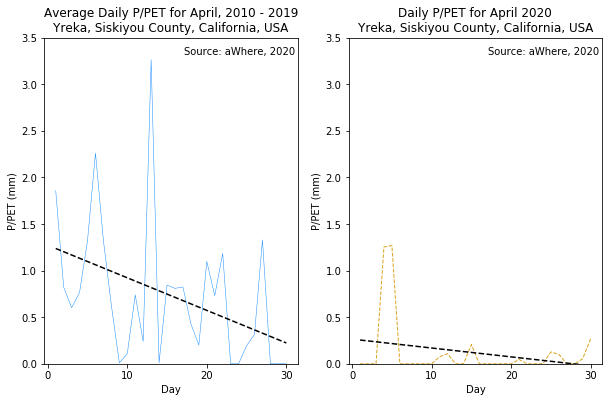
The ratio of precipitation to potential evapotranspiration (P/PET) was chosen as a potential drought indicator. P/PET is generally used as a measure of water stress in crops. When the P/PET ratio is above 1, more precipitation fell than water was lost to evaporation and via plant transpiration. When the ratio is less than 1, that relationship is reversed. This data exploration step measures P/PET in Yreka, the county seat of Siskiyou County.
The first plot shows average daily P/PET for the month of April from the years 2010 through 2019. A line of best fit shows a downward trend, indicating historically greater water stress throughout April. The dataset is noisy, however, so the decision was made to modify this indicator (next figure).
The second plot shows the daily P/PET values for April 2020. The ratio peaked early in the month, perhaps due to a large percipitation event, then returned to low levels. A line of best fit indicates a downward trend, and the values are lower on average than historical norms suggest.
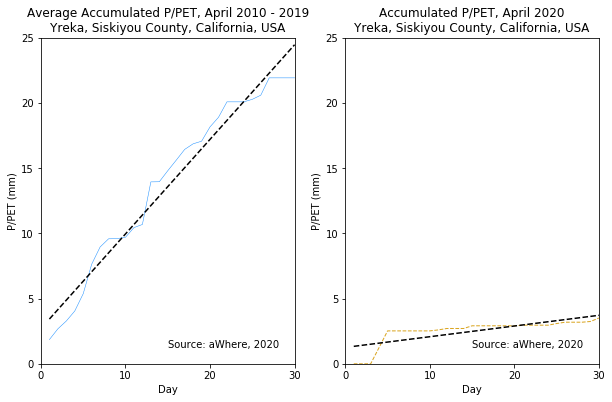
Since the data shown in the average daily P/PET plots were noisy, the total accumulated P/PET (aP/PET) was analyzed for the same location. This measurement reflects average daily total P/PET over a specified time period. It was thought that this measurement would show fewer day-to-day variations.
The first plot shows a steady increase in the aP/PET throughout April. The second plot, however, shows that April 2020 saw an extremely low accumulated P/PET value throughout the month. Though preliminary, this step indicates that P/PET is a candidate for drought quanitification since it is less sensitive to daily variations.
Simplified workflow for last 2 plots:
- Pass values for norms to aWhere API
- Pass values for April 2020 to aWhere API
- For both above steps, results were limited to 10 days per returned JSON. So a function was written that adjusted the OFFSET argument passed to the API for each set of 10 days.
- Data converted from geodataframe to pandas dataframe
- Line of best fit calculated in plot
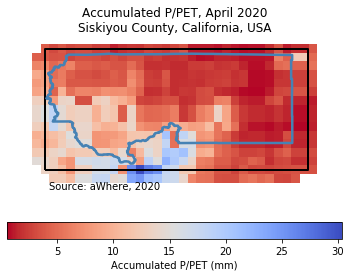
The final data exploration step was to provide a spatial dimension to the A-P/PET for April 2020. Each polygon in the plot represents a 9km by 9km cell that aWhere ses for agronomic analysis and weather prediction. The last figure confirmed that A-P/PET provided a less noisy dataset for analysis. This plot shows that the majority of Siskiyou County has low levels of accumulated P/PET, with the areas representing historical norms lying outside of the county. A value of 30 for the A-P/PET indicates that each day in April has a P/PET value of near 1.
Simplified Workflow
- Create path to grid geojson created from Kale Kochenour's aWhere grid creation script
- Find centroid of each polygon
- Extract x and y coordinates from each centroid
- Pass to aWhere's API to get A-P/PET for April 2002
- Save results from (4) as geodataframe
- Plot using geopandas and matplotlib
Next Steps and Directions
- Compare A-P/PET for other months to historical norms. Explore line equation and calculate R-squared to determine goodness of fit.
- Calculate norms for A-P/PET for entire area of interest. Extend time period to match with different phases/levels of drought per the U.S. Drought Monitor.
- Using A-P/PET, determine suitability for crops compared to past suitability for crops: are the areas where crops are being grown still suitable for those crops?
- Find centroid and extents of droughted area. Explore the way in which this area expands, contracts, and relocates over the years.
- Calculate NDVI and examine relationship with A-P/PET
Data Sources
Articles
- Redmond, Kelly. "The Depiction of Drought". Bulletin of the American Meteorological Society. August 2002.
- With shrinking snowpack, drought predictability melting away. Science Daily. April 20, 2020.
- Cooley, Savannah S et al. "Assessing regional drought impacts on vegetation and evapotranspiration: a case study in Guanacaste, Costa Rica". Ecological Applications 29(2), 2019.
- Rangwala, Imitaz. "Monitoring and Predicting Drought on our Grasslands". Grassland News Newsletter 2020.
- JRC Global Drought Observatory and ERCC Analytical Team. "Drought in Zimbabwe, Zambia and south Mozambique February 2020". Global Drought Observatory Analytical Report. Feb 13 2020.