Landslide detection using Synthetic Aperture Radar and Multispectral imagery
Nasim Mozafar Amiri, Mentor: Elsa Culler
August 2023
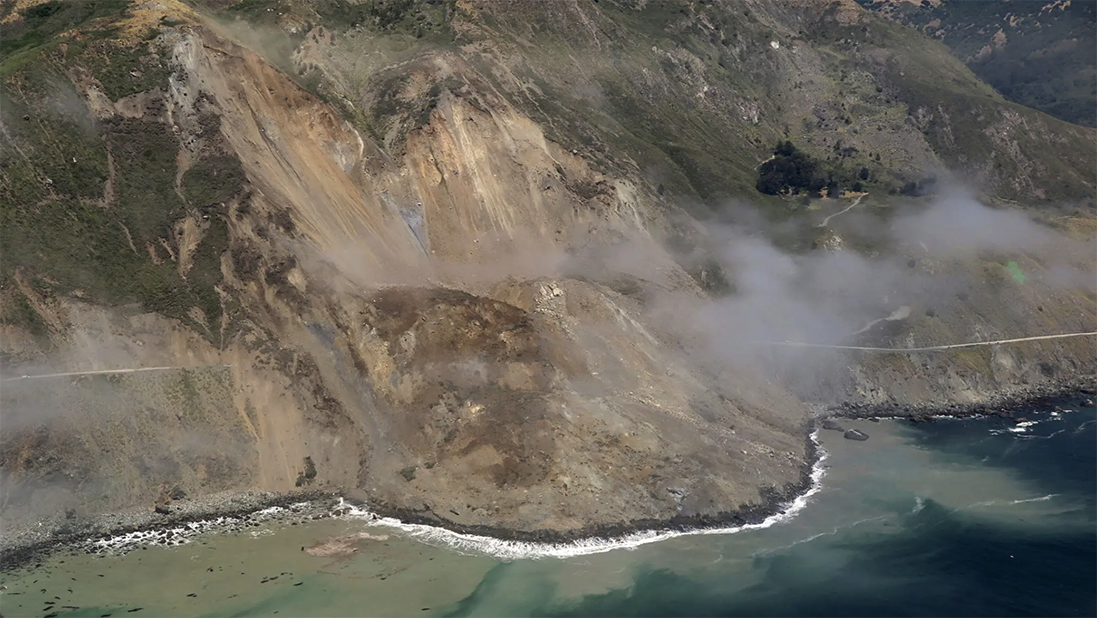
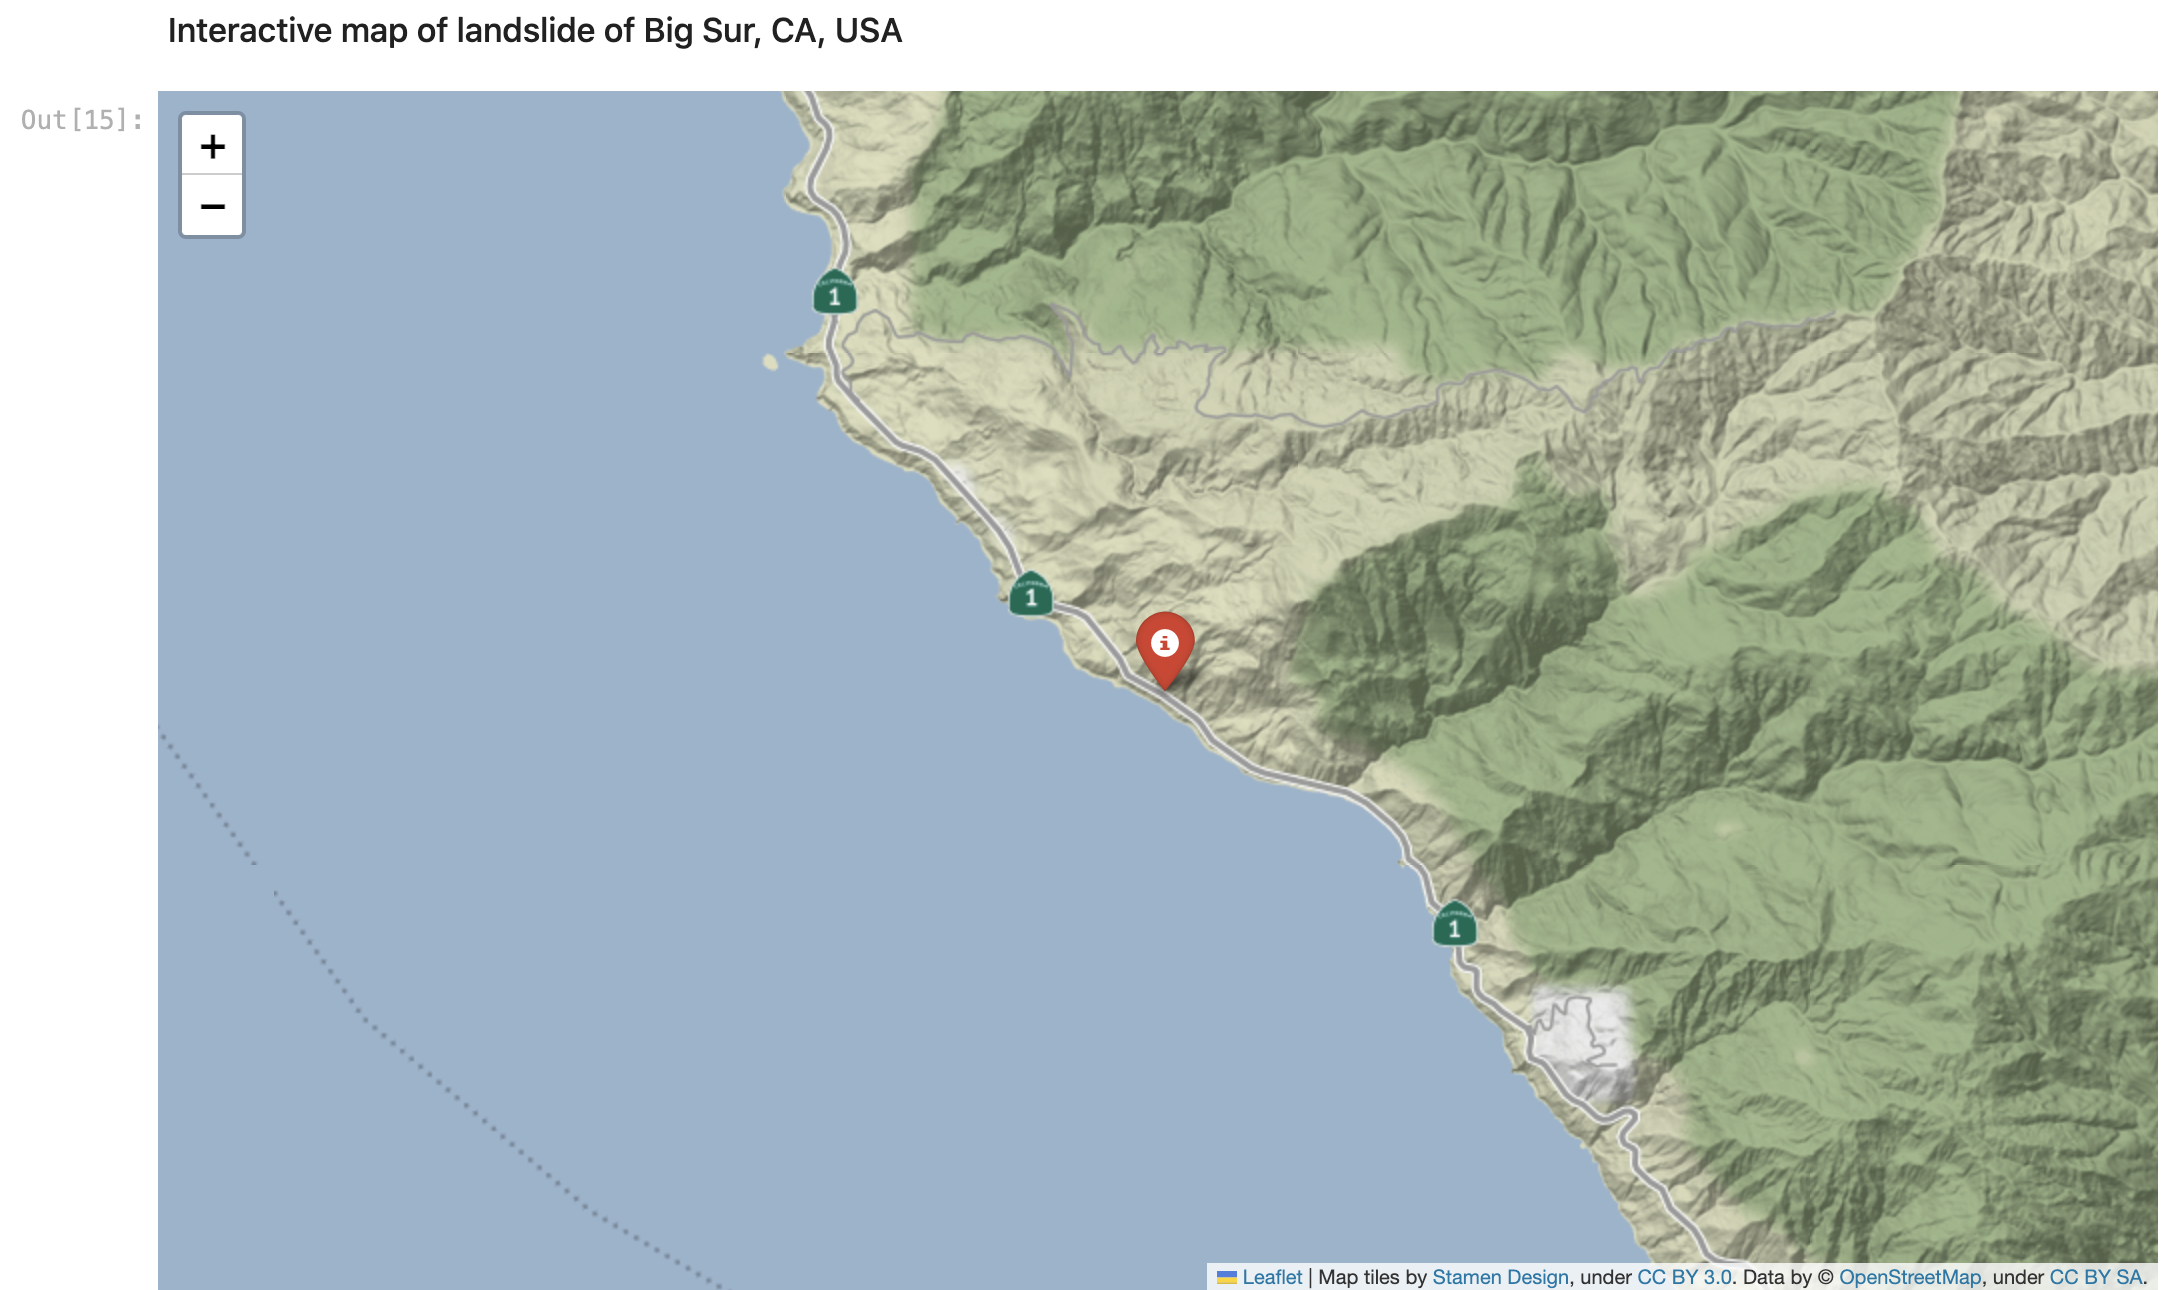
Big Sur landslide, Highway 1, California, USA, Image credit: The New York Times
Area of Interest (AOI)
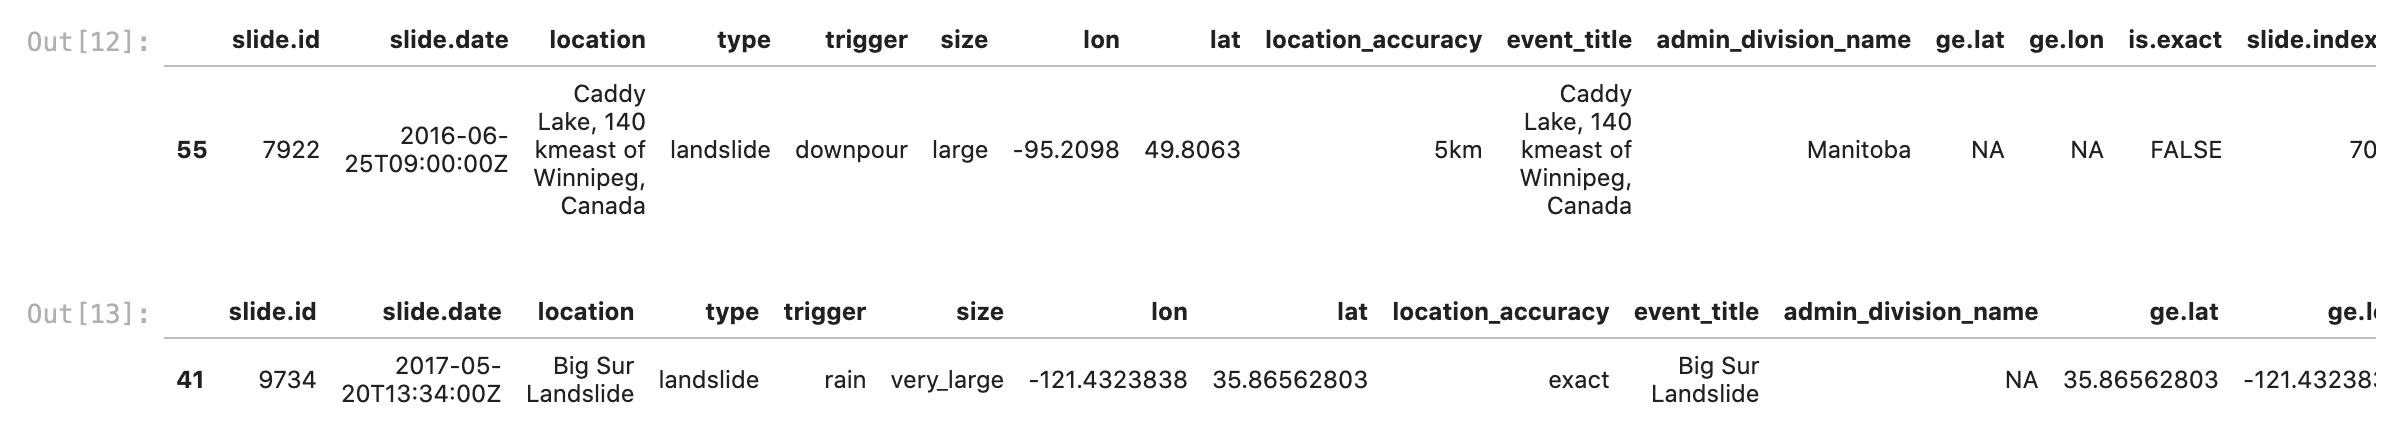
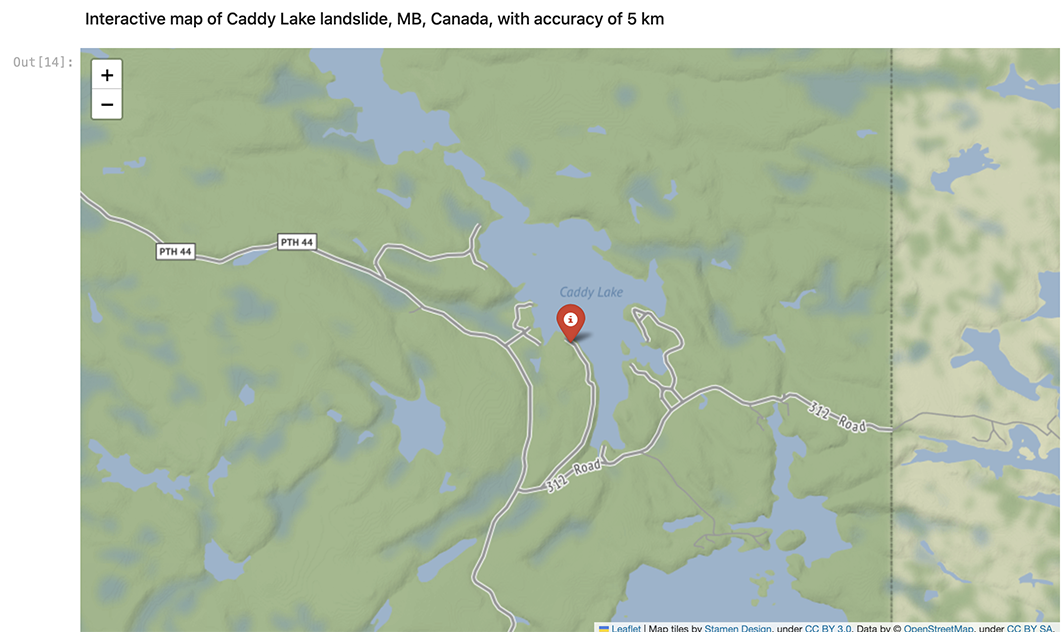
We studied two landslide events namely, Caddy Lake, Manitoba, Canada (June 25, 2016) and Bug Sur, California, USA (May 20, 2017). We opted for these selections to assess the functionality of our code across varying types and sizes of landslides. While the first is characterized by scattered land removal across an area of about 5 square kilometers, the last caused a substantial mass movement across the highway.
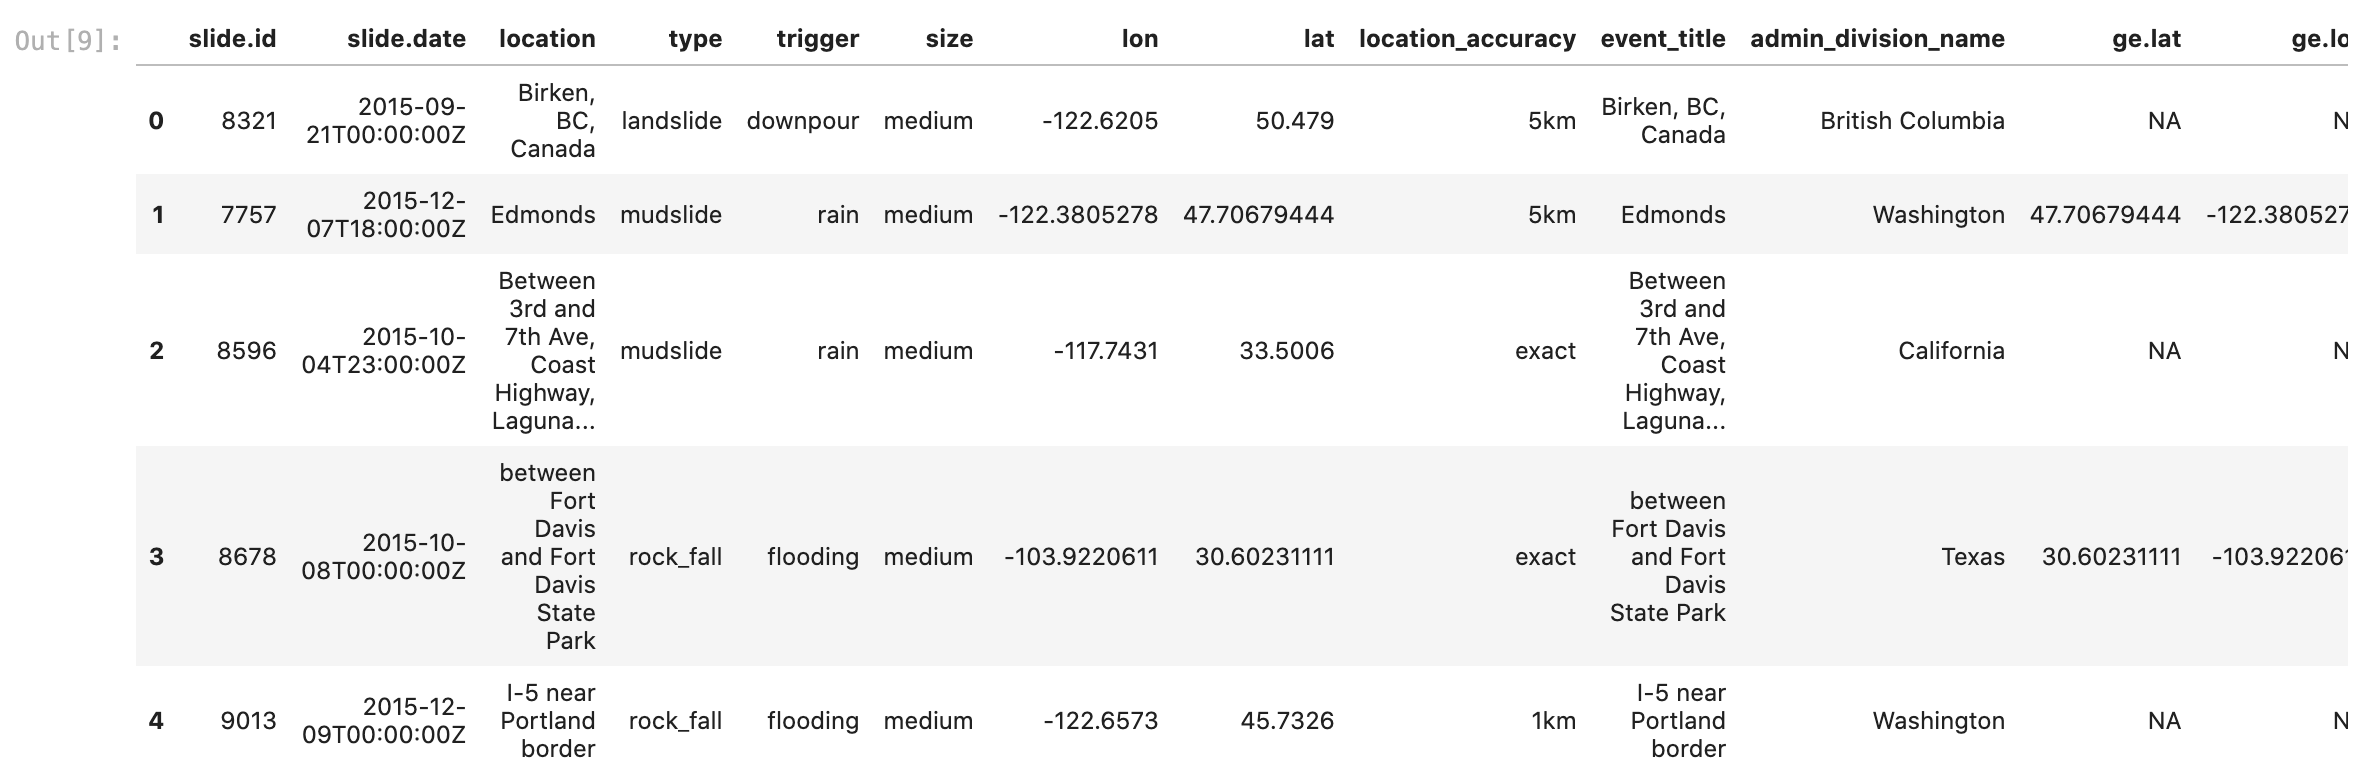
Extracting Caddy Lake and Big Sur landslides data
An introduction to Sentinel 1 and Sentinel 2 imagery
Sentinel-1 and Sentinel-2 play pivotal roles within the Copernicus program initiated by the European Space Agency, contributing essential data for diverse Earth observation applications. Sentinel-1, functioning as a Synthetic Aperture Radar, delivers all-weather surveillance and monitoring capabilities by transmitting radar signals and capturing their reflections. This unique capacity permits the observation of Earth's surface regardless of cloud cover or daylight conditions, proving especially valuable for precise monitoring of ground shifts and changes such as deforestation. In contrast, Sentinel-2 employs multispectral sensors to capture intricate imagery of terrestrial and coastal regions. With the capability to collect data across 13 distinct spectral bands, Sentinel-2 is instrumental in monitoring factors such as vegetation health, alterations in land cover, urban growth, and disaster assessment.
Collecting and analyzing SAR images (Sentinel 1)
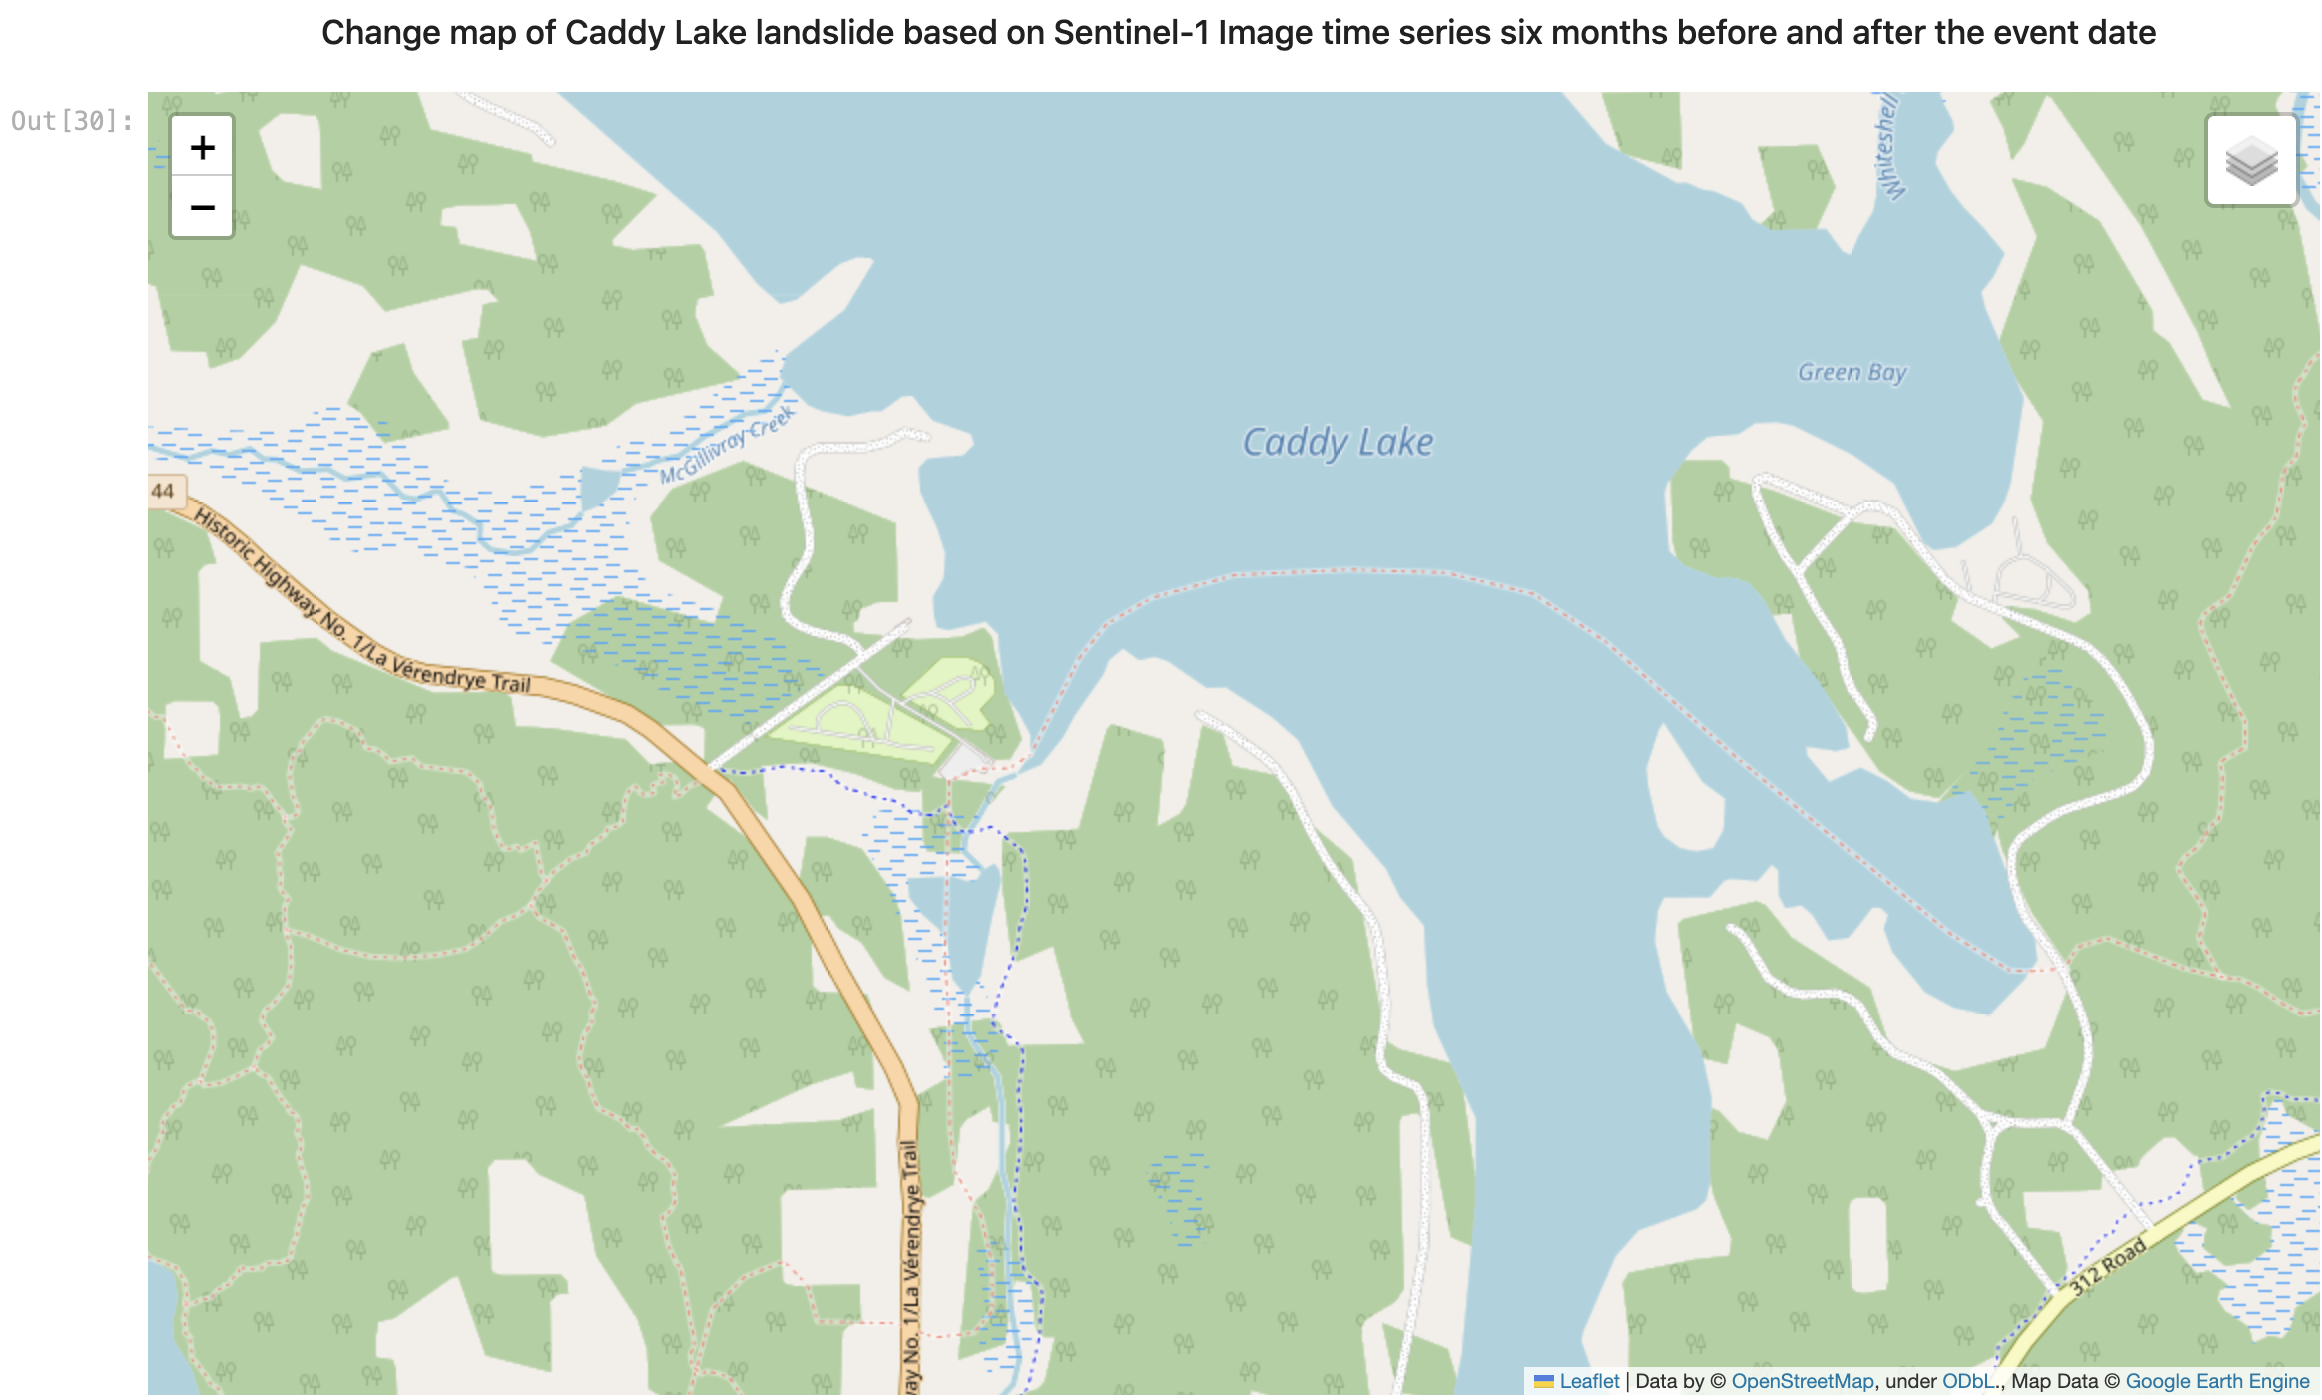
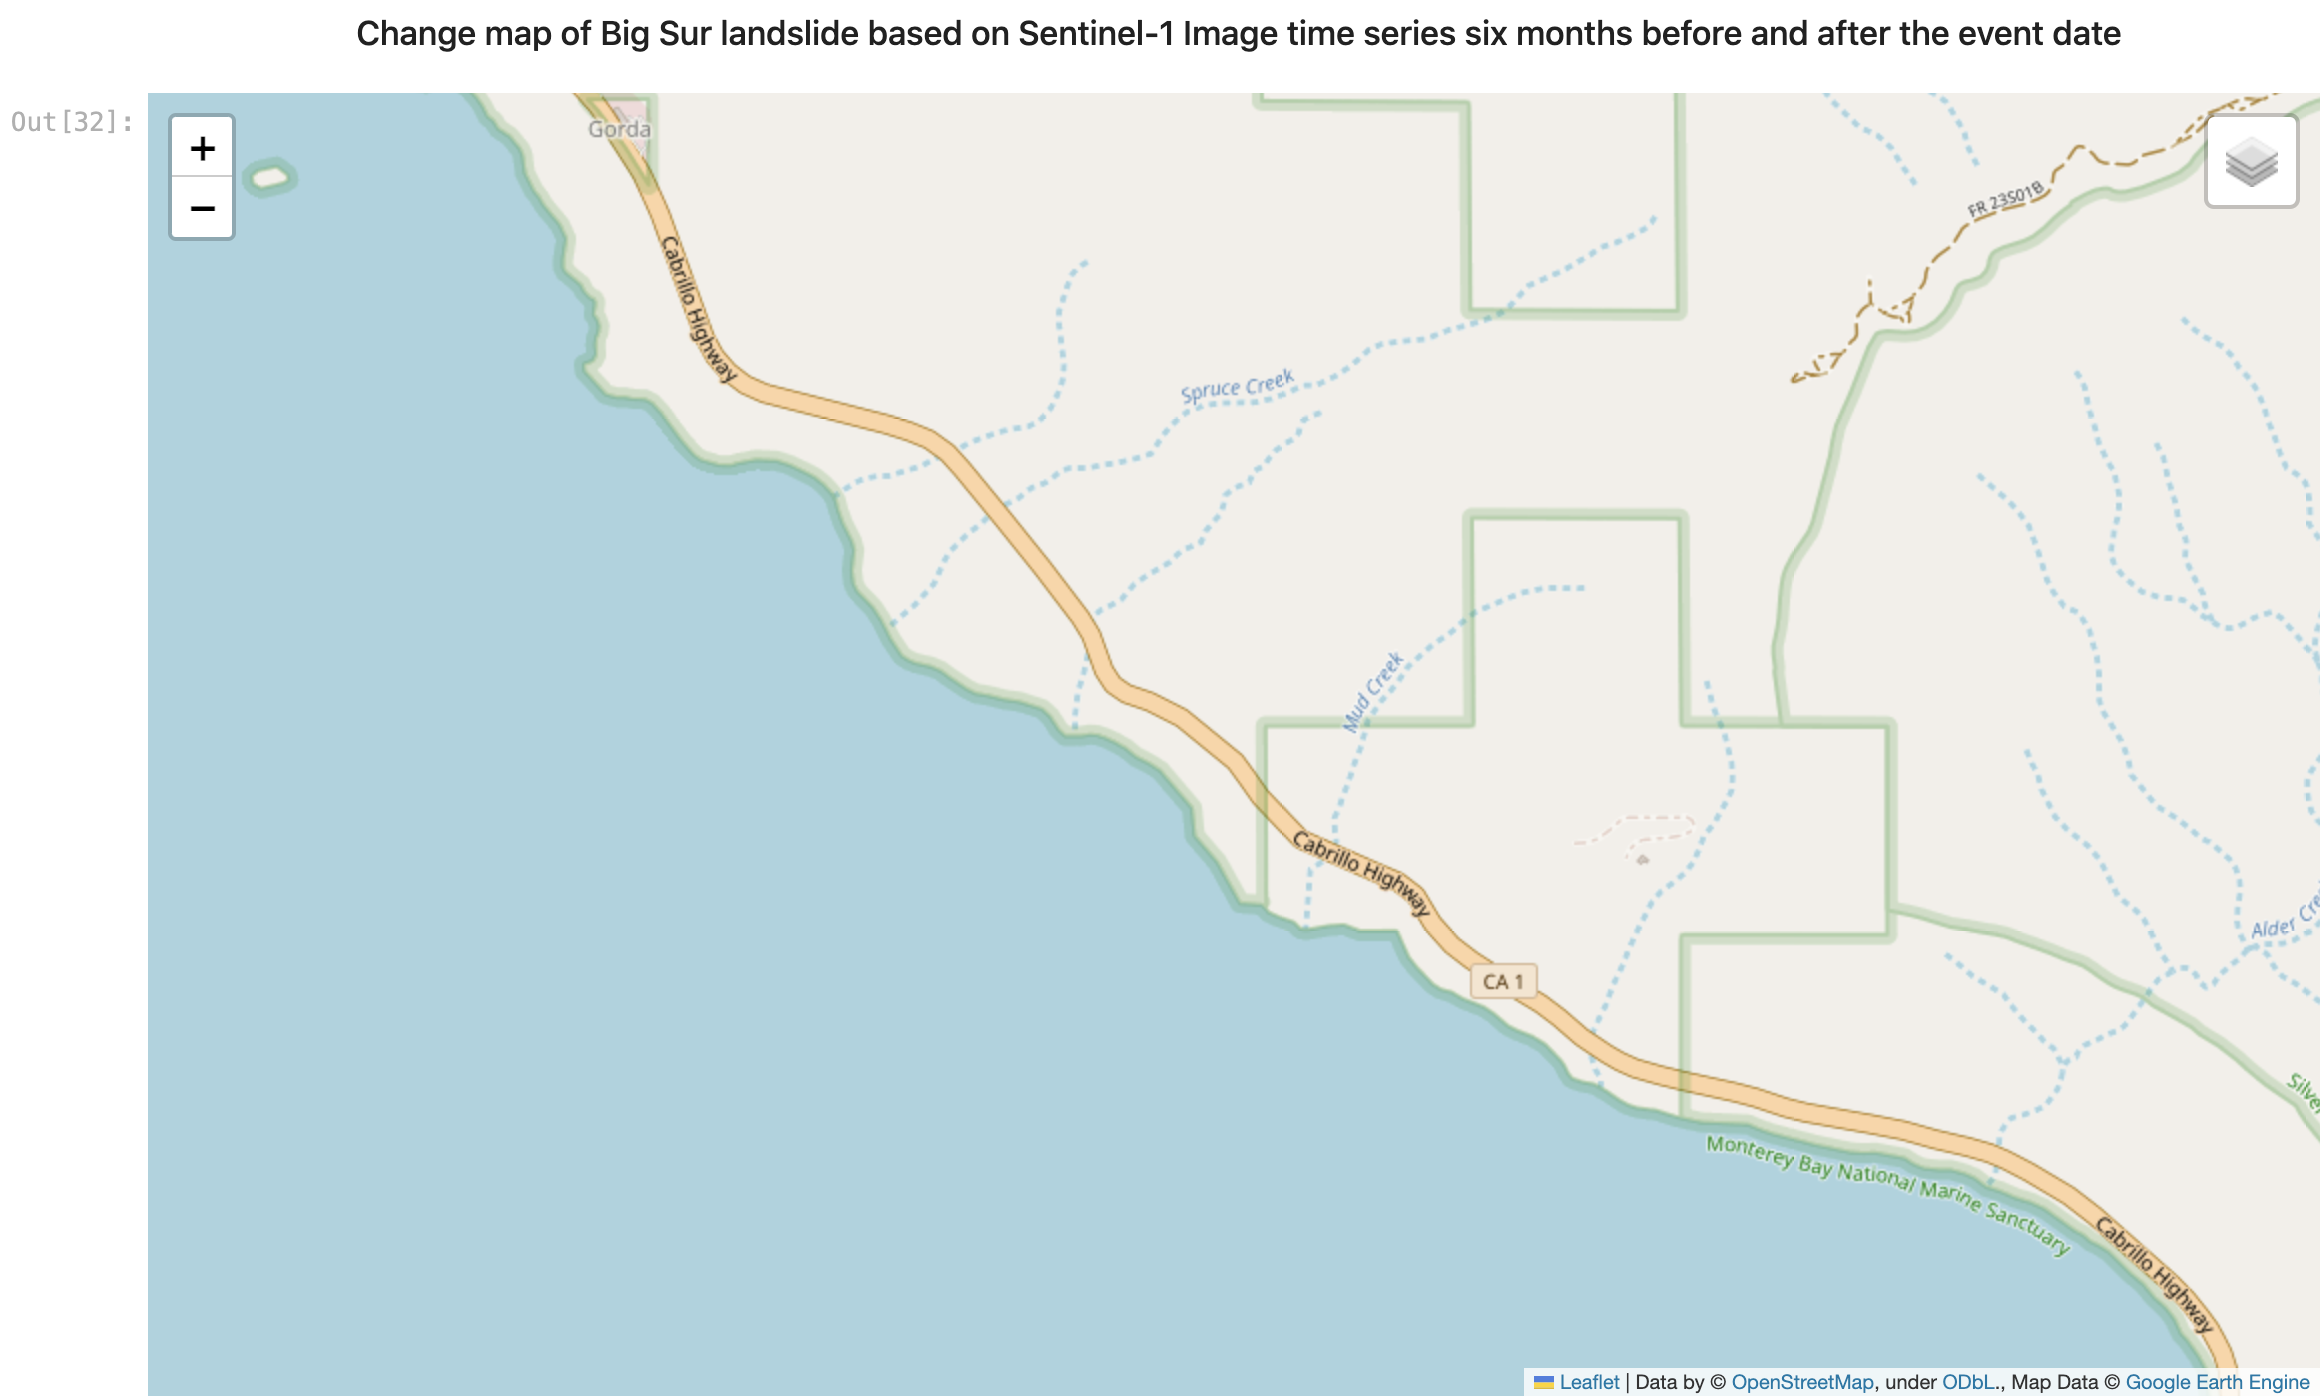
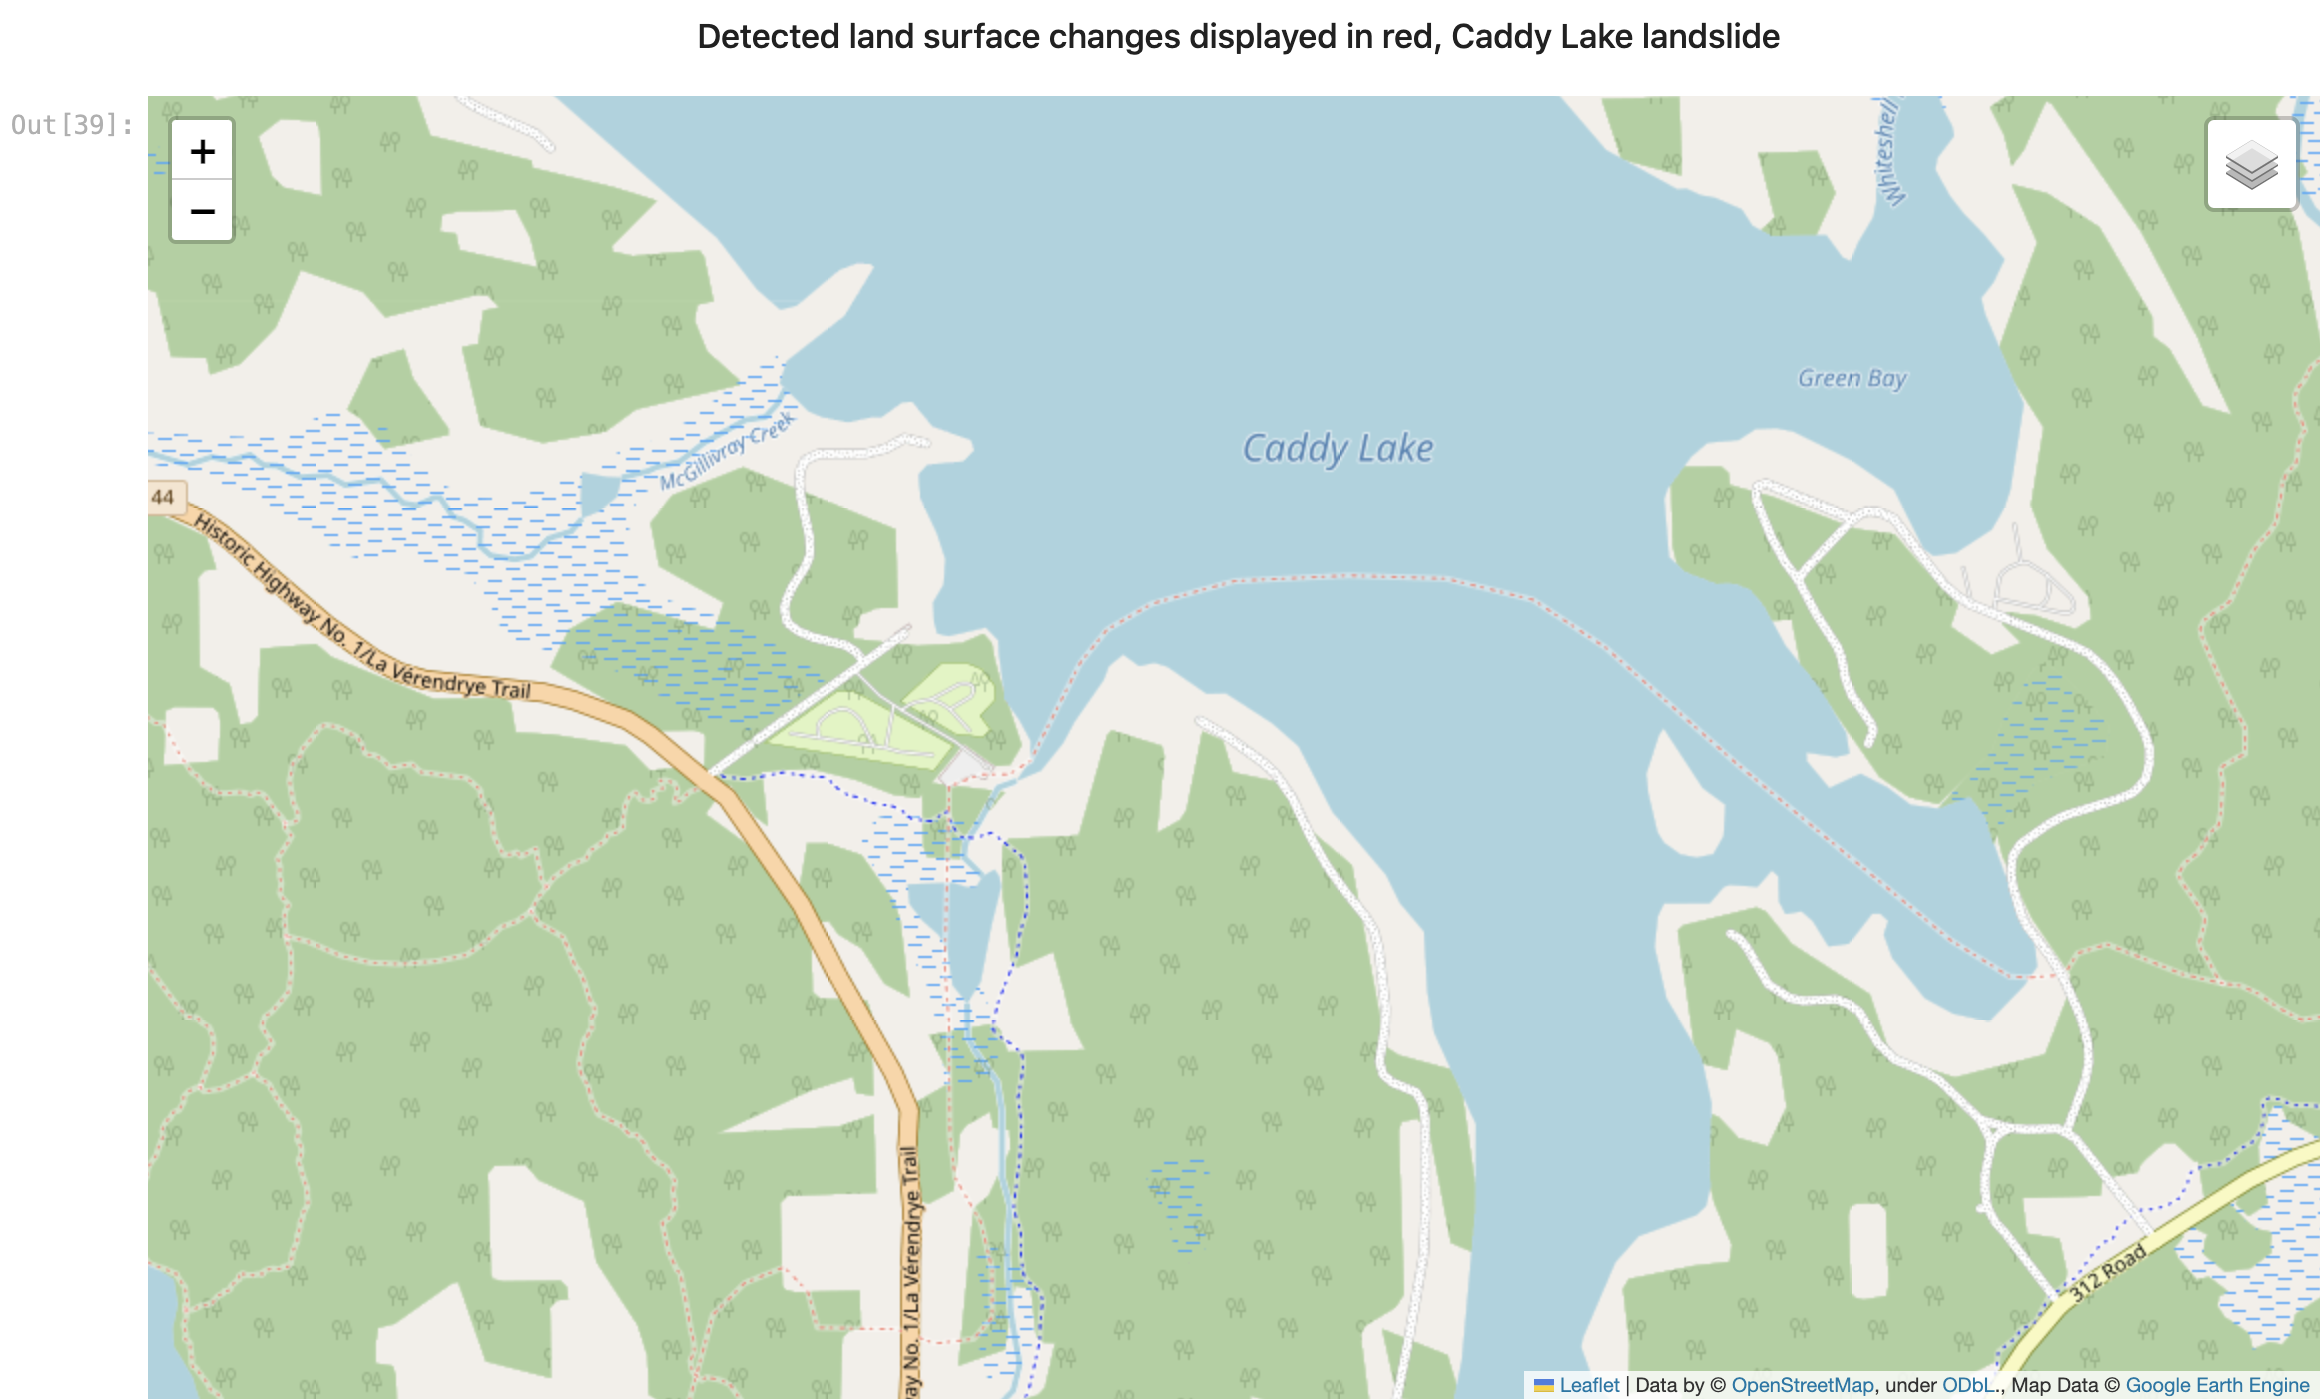
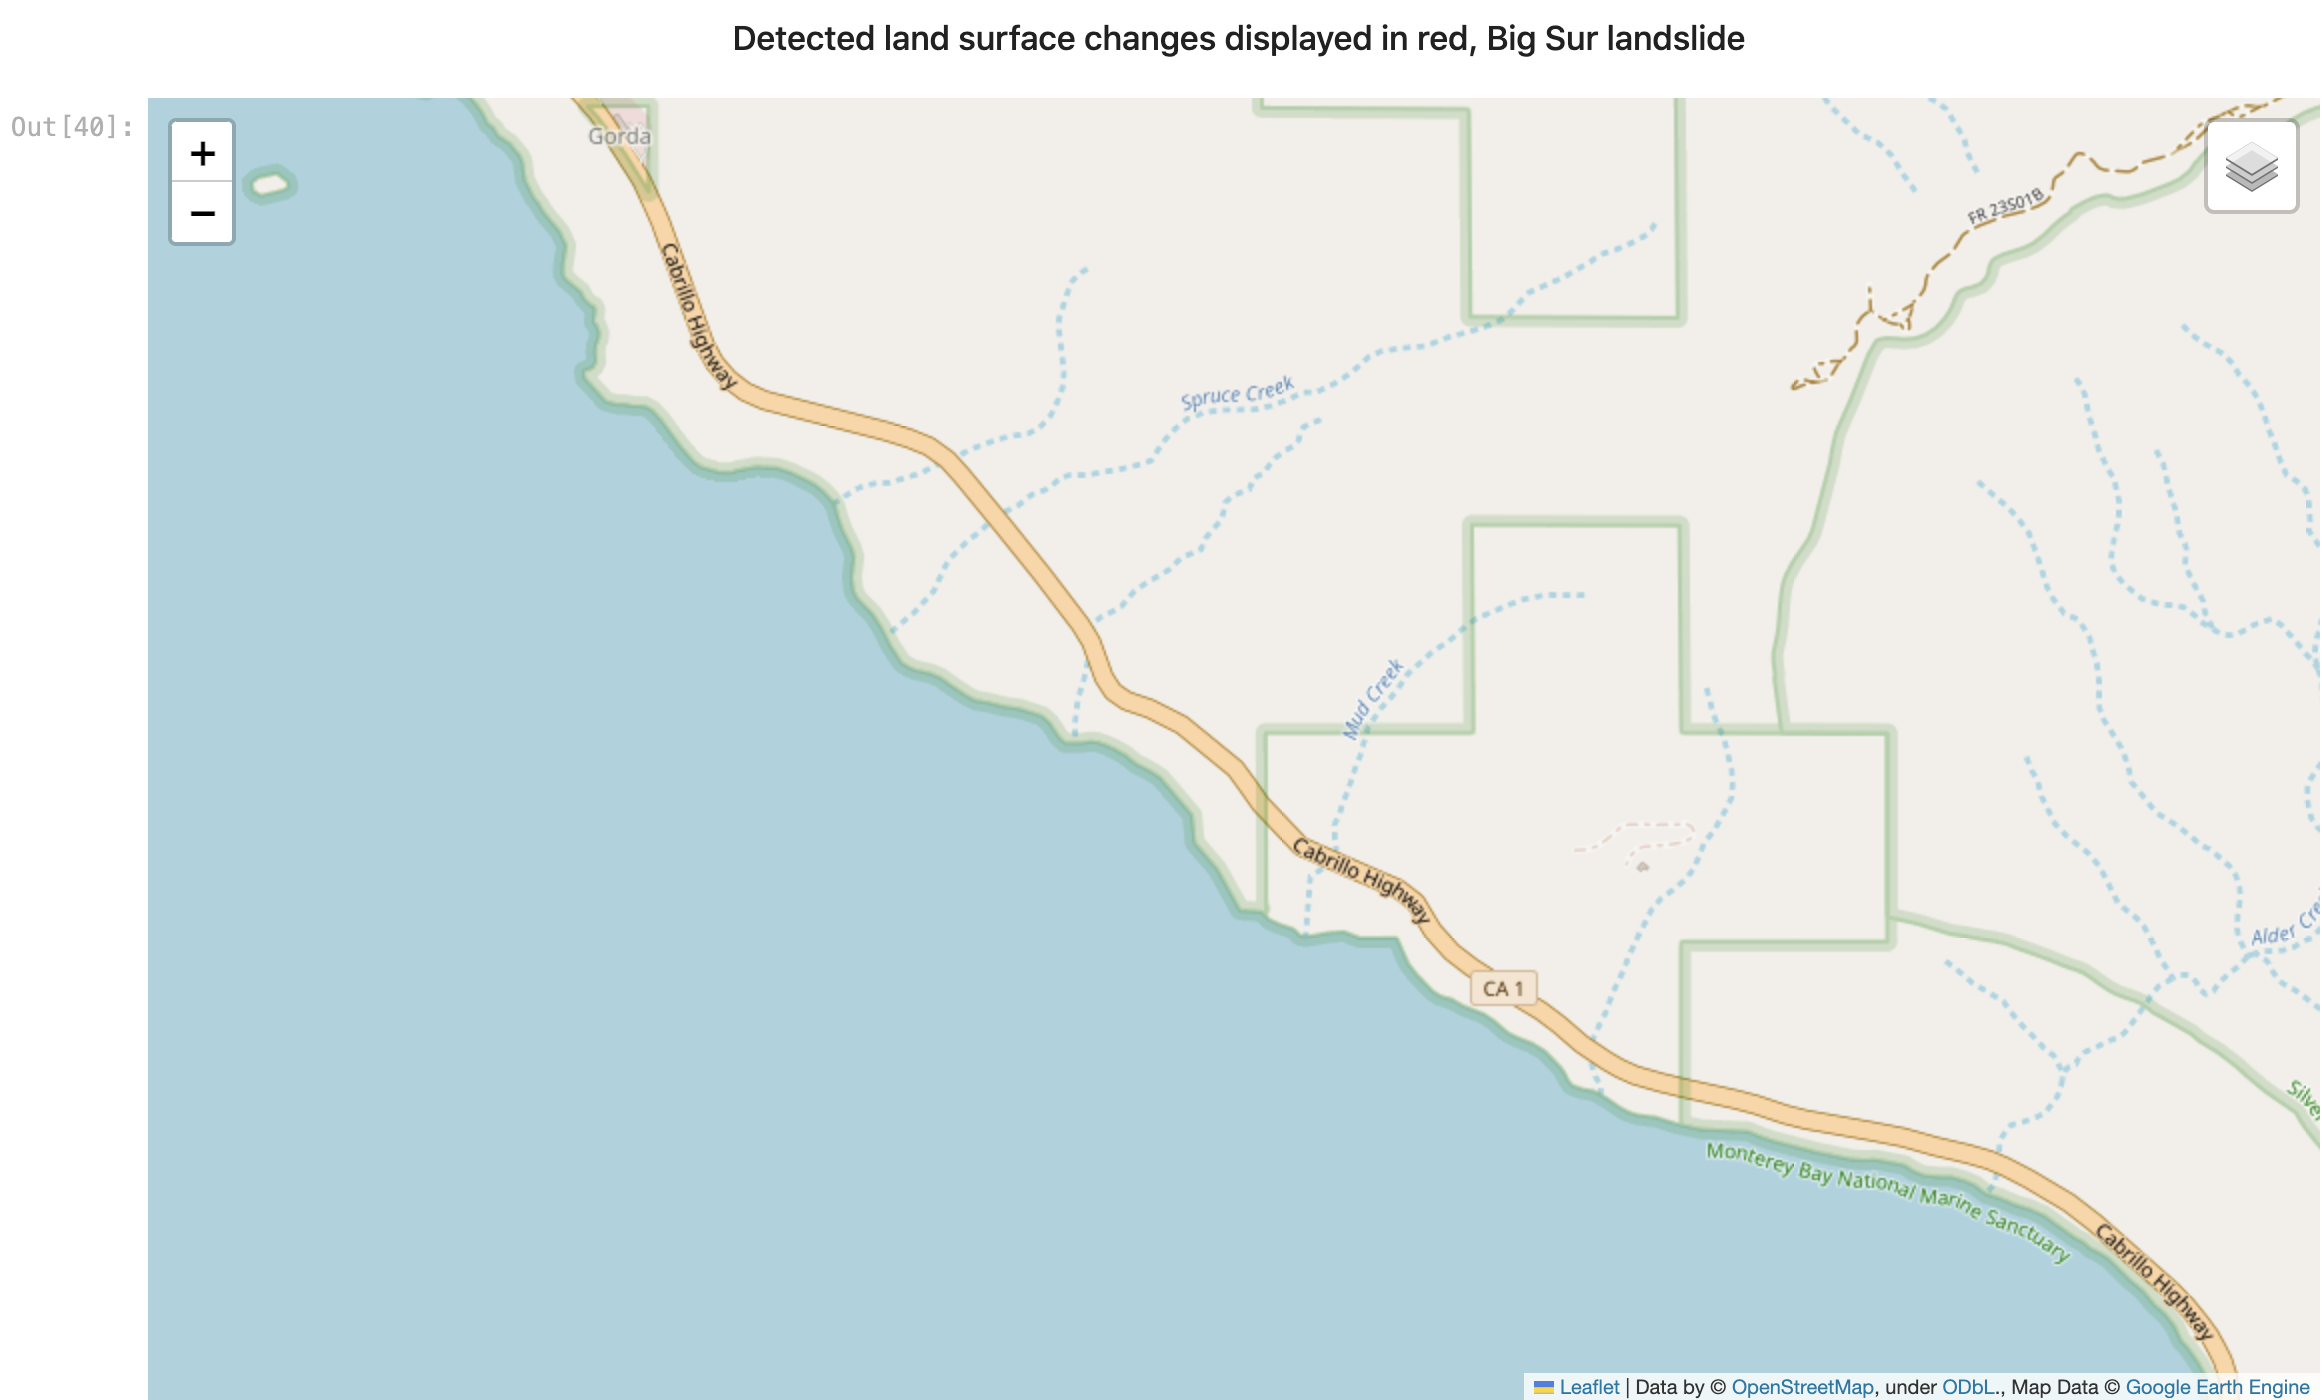
We retrieved times series of SAR (Sentinel-1) satellite imagery within a time span of 180 days before and after the event dates to monitor pre- and post- event changes containing 27 and 31 images, respectively, for Caddy Lake and Big Sur locations. By analyzing the time series data, we have the capability to generate change maps, in which the land changes are represented by the red areas in the maps presented below.
Collecting and analyzing multispectral images (Sentinel 2)
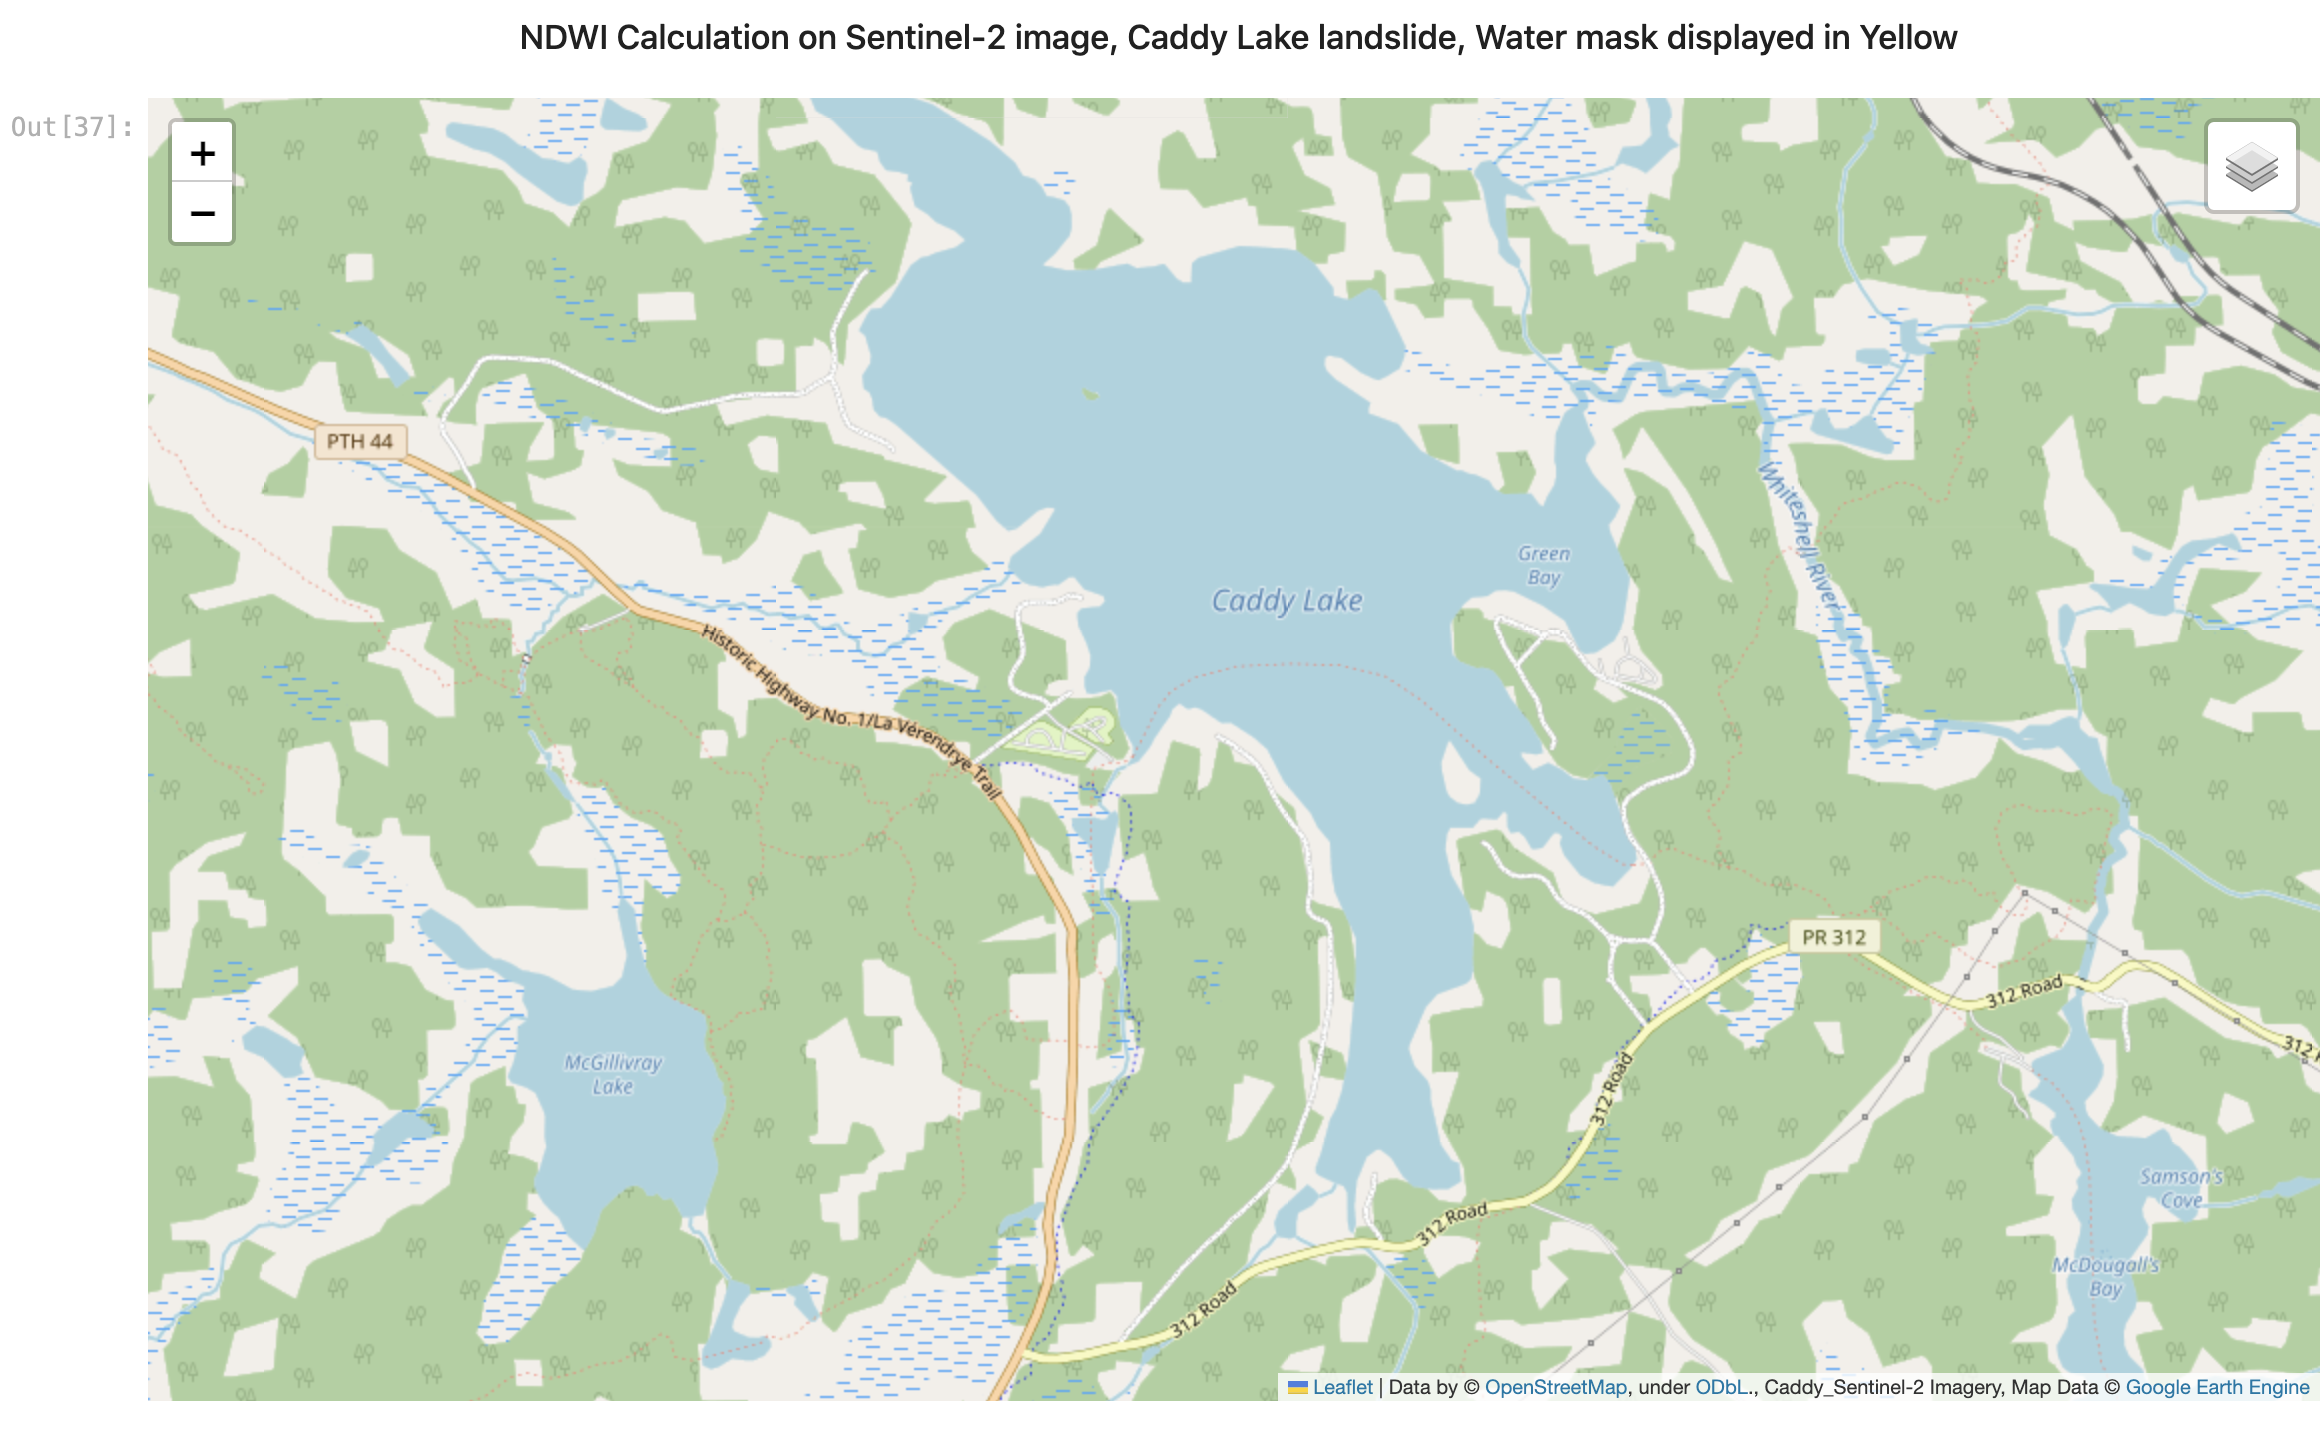
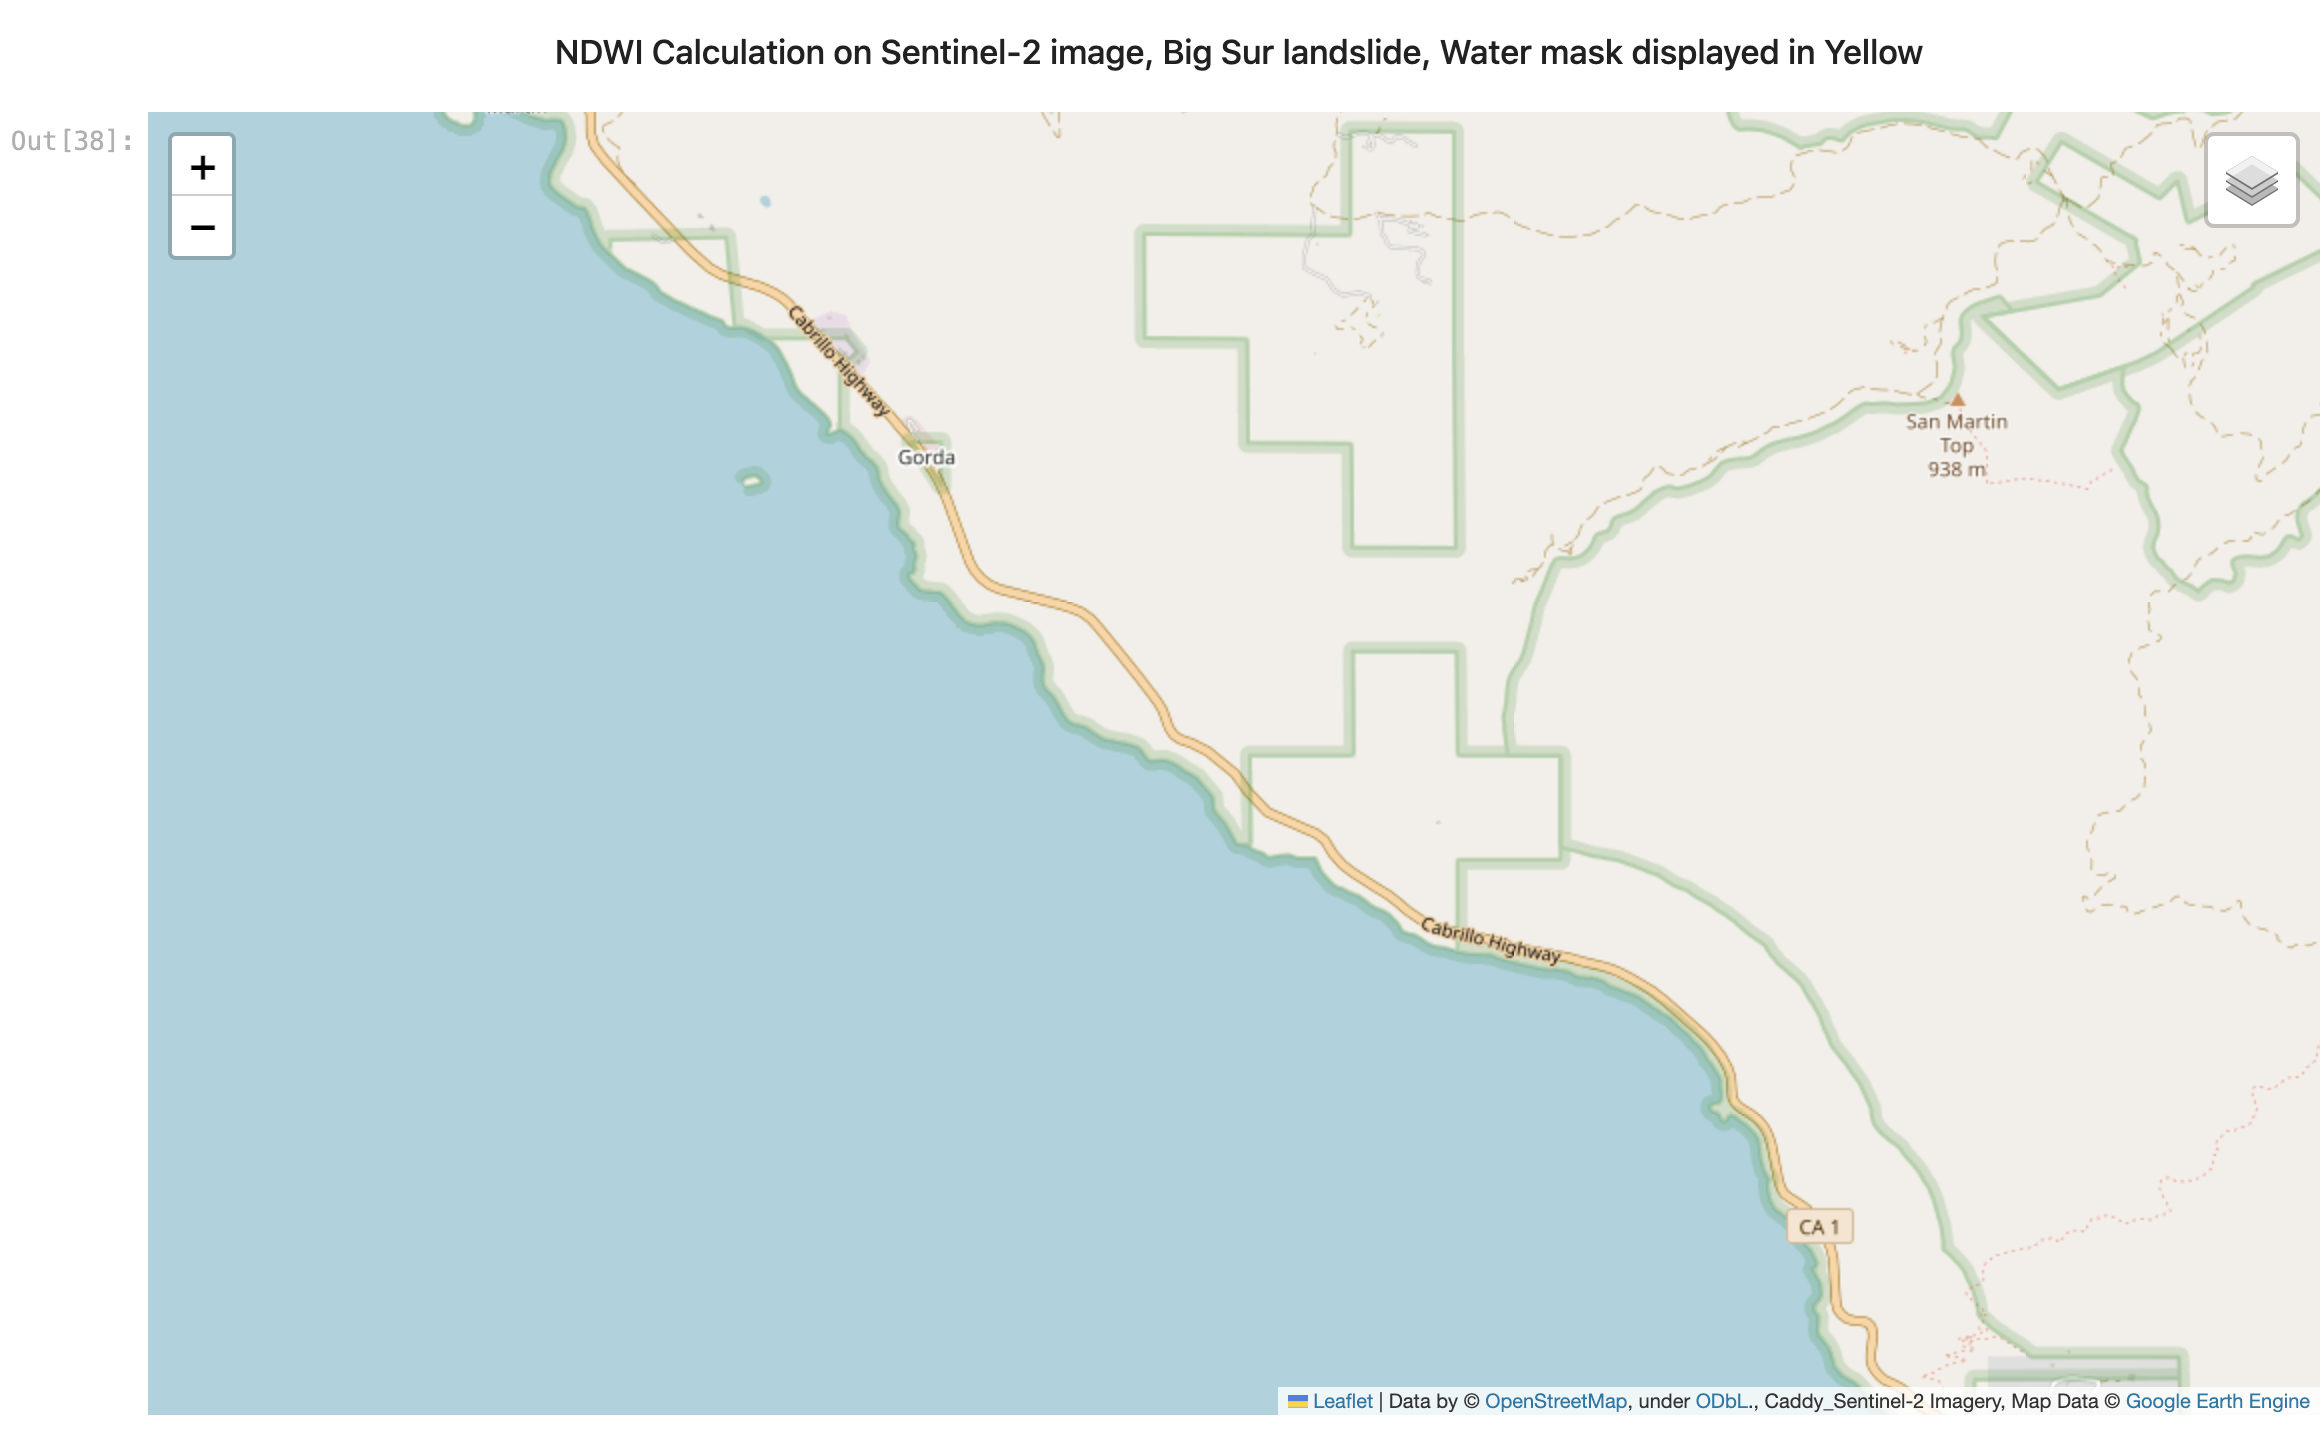
Upon the creation of change maps, the process of applying the Normalized Difference Water Index (NDWI) involved obtaining multispectral images corresponding to the Caddy Lake and Big Sur areas. However, for the application of the water mask, we exclusively utilized the last image in the time series. The resulting maps showcase water bodies highlighted in yellow.
Land Surface Change with applying NDWI
After completing our statistical analyses and excluding water bodies, the red color layers align with changes in reflectance intensity from satellite images. These areas in red indicate the removal of Earth's surface, highlighting the occurrence of a landslide in our context.
Summary and results
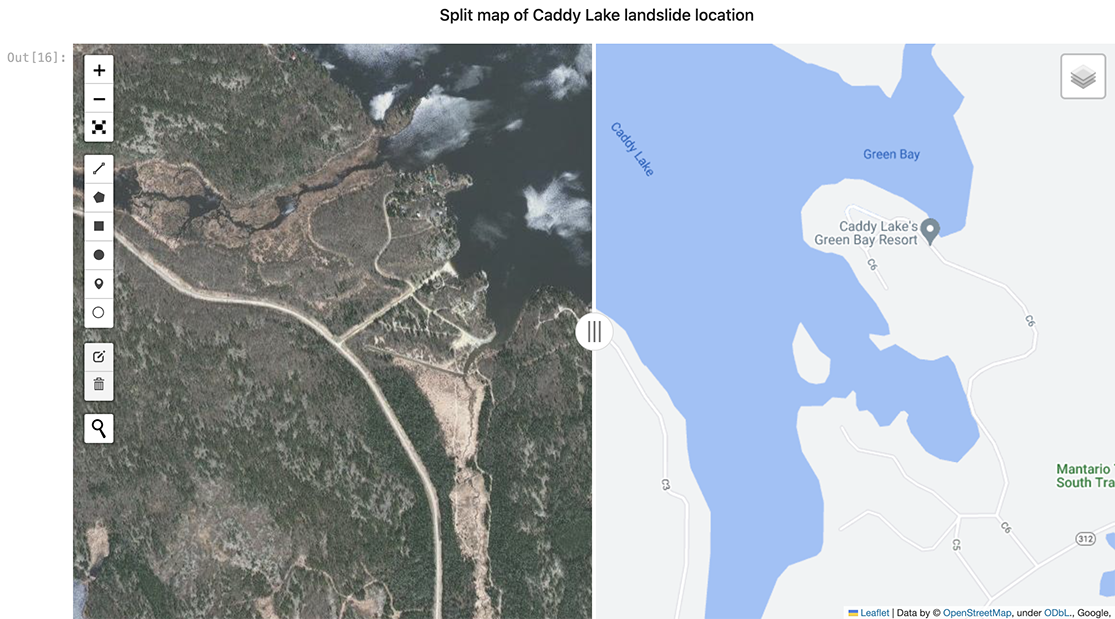
In the preliminary phase of the project, land changes due to landslide of Caddy Lake, Manitoba, Canada, on June 25, 2016 using SAR (Sentinel-1) satellite images has been detected. Accordingly, appropriate times series of SAR images within a time window of six months before and after the event date are processed to pinpoint pre- and post- land surface changes due to landslide. Unlike a large landslide with a significant mass movement, the reported land surface changes were not the result of a major shift. Instead, they involved smaller slope movements scattered across an area of about 5 square kilometers.
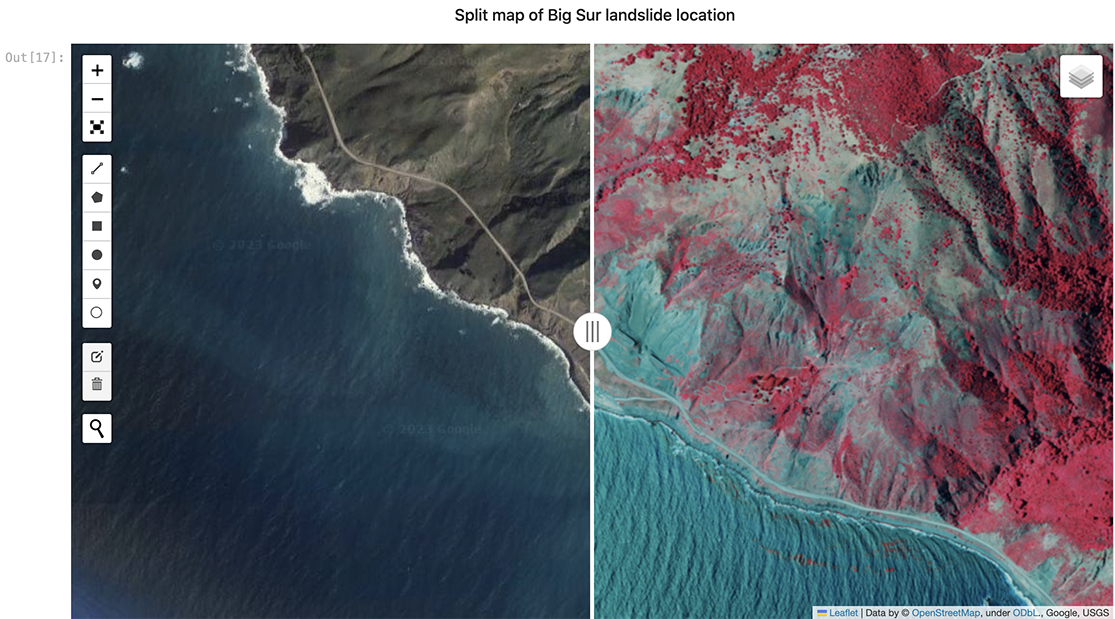
To further test our methods, we also looked into the Big Sur landslide that took place on May 20, 2017. This event involved a substantial mass movement and we used a similar approach to our previous analysis. We were able to accurately detect downward slope movement in this case. However, there is a twist, since both of these locations are close to large bodies of water. This led to water areas being included within our analysis and defined as land changes. To address this, we tried a different tactic. Instead of directly applying a water mask to SAR images (which we found it quite difficult following multiple attempts), we applied the water mask to multispectral images (Sentinel-2). Then, by combining the various steps we have developed a method to distinguish between water areas and changes in the land surface effectively.
Our study underscores the remarkable and substantial capability of the synergistic integration of Synthetic Aperture Radar (SAR) and multispectral imagery in landslide study. Satellite images from Sentinel-1 SAR are really handy to spot changes on the ground, no matter how big or small the area is. When we use Sentinel-2 images, they help us tell apart water and land changes. By putting together SAR and multispectral images, we have a strong way to look into land changes while leaving out water bodies. This combo is a great tool to keep an eye on land shifts, like possible landslides. This capability besides enhancing our understanding of land alterations opens doors to broader applications in fields such as disaster management, urban planning, agricultural monitoring, and ecological assessments.