Sage Advice
By Kelsey Beckrich, Sarah Jaffe
This project uses endmember extraction to detect sagebrush and cheatgrass in a sagebrush/steppe environment and plots their abundance. We found a variety of relevant open source data, but the low-growing vegetation characteristic of sagebrush ecosystems makes it difficult to validate remote-sensing models. In fact, the short stature of sagebrush meant that the coordinates for ground-truthed sagebrush were not recorded because the shrubs were invisible to remote sensing instruments (Ben-Arie et al., 2009; Goulden & Scholl, 2019; NEON, 2020).
Despite these challenges, we found a workaround to validate our results which suggest that at least hyperspectral imagery has potential to detect sagebrush and cheatgrass. Unfortunately, this potential is unmet until on-the-ground data considers more inclusive approaches to validate remote sensing instruments in arid/semi-arid environments.
Why are we looking for sagebrush?
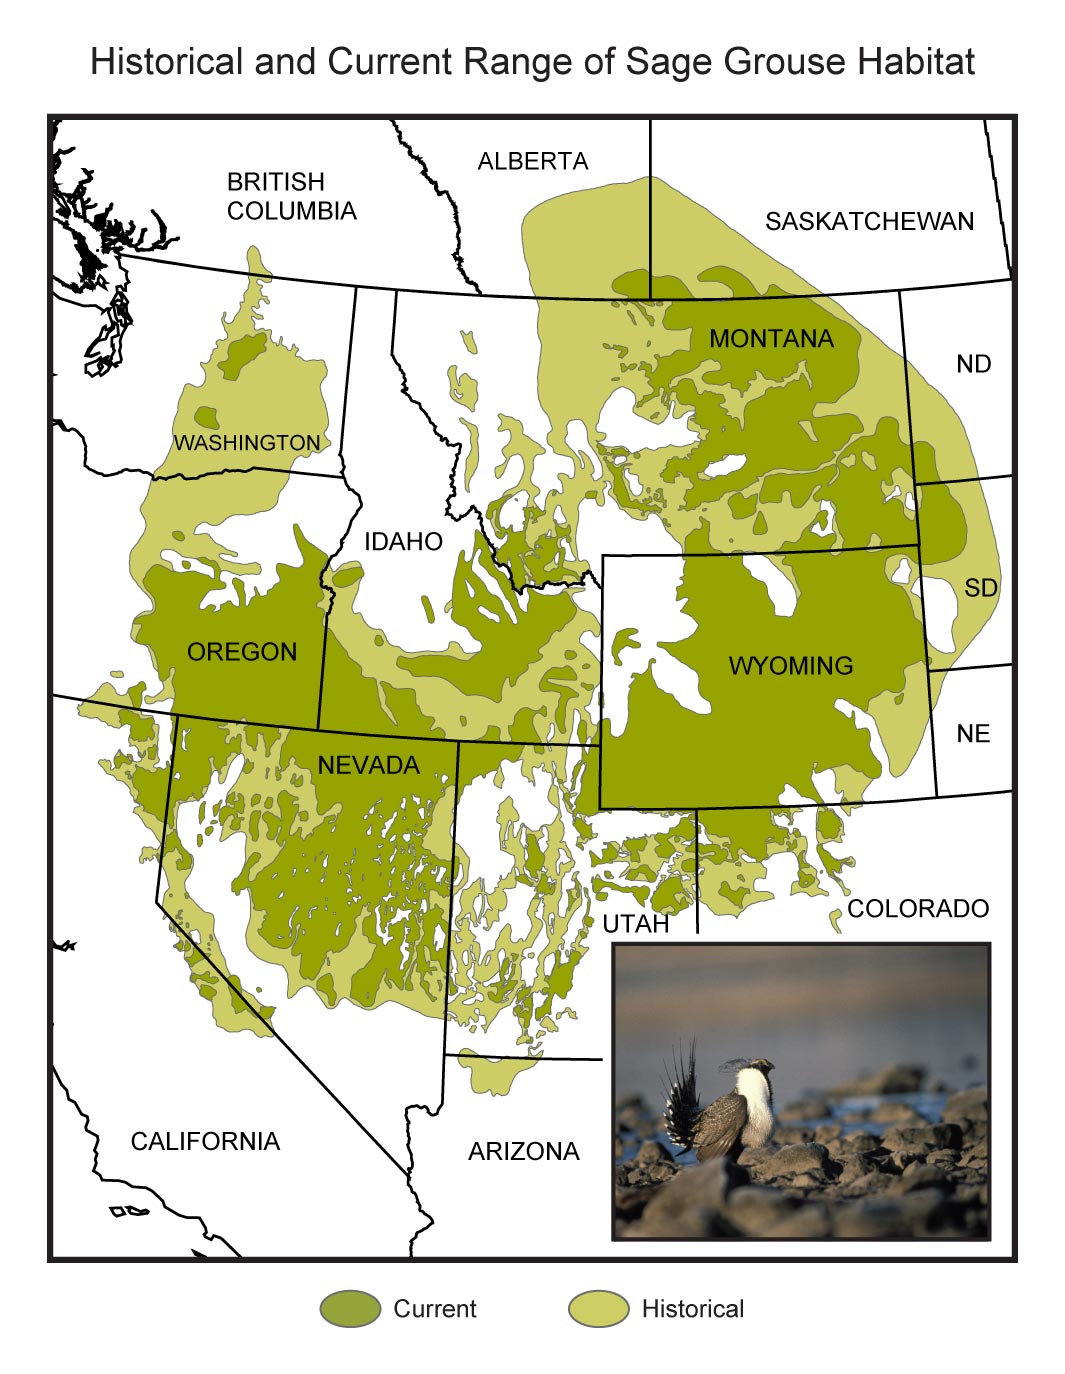
Sagebrush habitats support hundreds of species of plants and animals across the western United States (Knick et al., 2003). It is estimated that the 150 million acre range of sagebrush has declined by 56%, and the remaining sagebrush habitats are heavily fragmented from commercial landuse and invasive species (Davies et al., 2011; Knick et al., 2003; MacArthur & Plummer, 1978). Fragmented and reduced sagebrush habitat has very real impacts - see below for the change in greater sage grouse range, and obligate sagebrush inhabitant (Knick et al., 2003; Aldrigdge et al., 2008). This sage grouse map also illustrates the challenges of sagebrush conservation. Clearly, remote sensing data could take the strain off field surveys and benefit conservation efforts over this dispersed ecosystem.

Figure: The current and historical habitat distributions of the Greater Sage Grouse
Image Source: Aldridge et al. 2008
How can we see sage remotely?

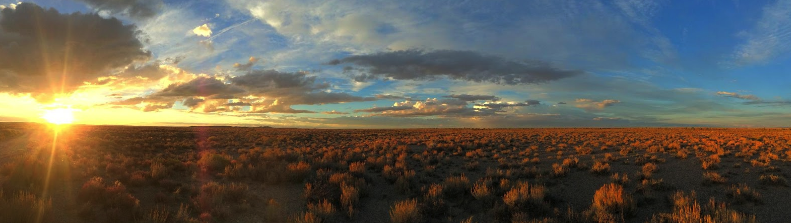
Sagebrush surrounded by cheatgrass
Image Source: USFWS
Pictured here in June, sagebrush shrubs stand out against invasive cheatgrass. Cheatgrass runs through its lifecycle before native plants green up, creating stark visual contrast for us. We wanted to see if spectral data could capture these distinctive colors - how would these colors looks to a spectrometer?
Sagebrush and Spectral Data
Spectrometers record wavelengths of light reflected from the ground and groups these wavelengths into sections called bands. Looking at the proportion light reflected in each band allows us to detect objects on the ground through their 'spectral signature', a unique curve generated by plotting the reflected light at each wavelength from an object. By analyzing these spectral signatures, we can understand how spectrometers 'see' and record different objects.
Spectral data comes in a variety of resolutions, and the optimal resolution to identify a single plant species, like sagebrush, is unclear. Consequently, Sarah Jaffe and I developed the same workflow for two different data products: LANDSAT8 (per pixel resolution: 30 meters squared, 7 spectral bands) and NEON's hyperspectral data (resolution: 1 meter squared, 426 spectral bands). The following post focuses on the hyperspectral workflow. Results from Sarah Jaffe's multispectral analysis can be viewed by clicking on her link under Resources.

This plot confirms that the spectral signatures of cheatgrass and sagebrush are distinct. Now that we know how they look to a spectrometer, I utilized an algorithm to 'search' through an image to find one or both of the target species.
Searching for Sagebrush with an Endmember Extraction Algorithm
Every pixel captures some combination of land cover types (soil, water, vegetation, etc.). While the variation in land cover per pixel will vary depending on the image resolution and landscape, we need to tease apart the spectral signatures of each land cover within each pixel - a process known as endmember extraction. If we can accurately match these endmembers to known signatures of cheatgrass and sagebrush, we can then plot the proportion of sage or cheatgrass in each pixel of the image - a process known as abundance mapping.


Extracted Endmembers and Abundance Maps
The first plot shows the 7 most prominent landcover types. We can't confirm what these are, but, generally, spectral curves that sit high on graphs (reflect a lot of light) are soil. Curves that sit low on graphs (absorb a lot of light) are usually water. Spectral curves reflecting a lot of light in the near infrared spectrum (wavelengths 850 - 880) are generally vegetation. Subsequent plots show each endmember with a color image of the site and an abundance map of that endmember. Notably, endmembers 3 and 5 correlate with the spectral signatures of sagebrush and cheatgrass.

Comparison of Pure Spectral Signatures and Extracted Endmembers
The last plot compares known spectral signatures of sagebrush and cheatgrass with statistically similar endmembers. While the reflectance values differ, the curves are similar - particularly those for sagebrush.
What We've Learned about Remote Sensing and Sagebrush
The hyperspectral findings show that we can differentiate land cover types onsite, and some of these look a bit like cheatgrass and some a lot like sagebrush. Unfortunately, confirming that the sage-like spectra we see remotely is actual sage on the ground is not possible without the exact coordinates of the plants recorded, measured, and identified manually (NEON, 2019). So we can hazard some educated guesses for conservationists at where sagebrush and cheatgrass might be, but we would be much more confident in those guesses if we could validate what we see against documented plants in the area.
While I don't have the resources to collect these data, I recognize that unpublished data exists for these ecosystems. I also hope that these findings will prompt some discussion on how we validate data in arid/semi-arid environments with dwarfed vegetation. It seems like either 1) cataloging the spectral signatures of representative vegetation or 2) considering population size over individual size may be more useful for validating remotely detected vegetation types in these ecosystems. For these reasons, I'm working on a script to extract spectral signatures from spatially high resolution data which would be applicable for either mapped insitu data or cataloged spectral signatures.
Resources
Check out our code on github!
Kelsey Beckrich's endmember extraction and abundance mapping for hyperspectral (NEON) data
Sarah Jaffe's endmember extraction and abundance mapping for multispectral (LANDSAT8) data
Kelsey and Sarah's validation workflow for NEON's LIDAR CHM data
References
Goulden, T. & Scholl, V., NEON Algorithm Theoretical Basis Document (ATBD): Ecosystem structure. (2019) Provisional data downloaded from http://data.neonscience.org on July, 3 2020. Battelle, Boulder, CO, USA NEON. 2020.
McArthur, E.D.; Plummer, A.P. Biogeography and management of western native shrubs: a case study, section Tridentatae of Artemisia., Great Basin Nat. Mem., 2 (1978), pp. 229-243
Acknowledgements
This work couldn't have been done without support from Earth Labbers Jenny Palomino and Joe McGlinchy.