What's In My Water?
Maeve McCormick, advised by Chuck Rhoades and Tim Fegel
US Forest Service Rocky Mountain Research Station
for CU Boulder Earth Lab, Earth Analytics Applications Course, Summer, 2021
Feeling Thirsty?
Water is the most vital resource supporting life on Earth. Alpine, or high-elevation, watersheds are extremely valuable and vulnerable sources of freshwater in the Western United States. Alpine lakes are particularly important because they protect downstream water quality by storing nutrients (ions and natural compounds like salts, calcium, and ammonium). However, excessive accumulation of nutrients limits the lakes' natural ability to serve as buffers. If the nutrient balance in a lake is upset, the acid neutralization capacity (ANC) of a lake might change. ANC determines the amount of an acidic substance needed to change the pH of a volume of water. In other words, changes to ANC affect how salty (alkaline) or acidic a lake becomes. Such changes have long-term consequences for water quality, and directly affect the communities that rely on alpine sources of freshwater.
This issue is especially important as communities in the Western US grow. Population growth strains freshwater systems by increasing demand for use and exposure to pollution from agriculture and other human sources. Pollutants from human activities, such as nitrates, phosphates, and sulfates, accumulate in freshwater due to acid rain and snowfall, and affect nutrient balance and ANC. It is absolutely vital that the communities dependent on these vulnerable water resources implement management strategies to protect the environment and ensure communities in the west safely and sustainably persist.
In order to inform such water management strategies, my research used a long term survey of lake chemistry in Colorado to ask two main questions:
- Does geology affect baseline nutrient levels in alpine lakes?
- How is alpine lake chemistry (and water quality) changing over time?
Barkeep! A shot of...water? on the Rocks.
Wait. Geology!? What do rocks have to do with water quality? More than you think! ~
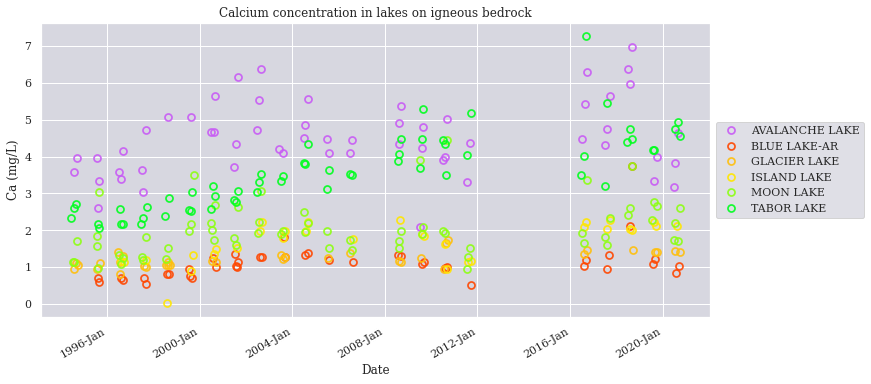
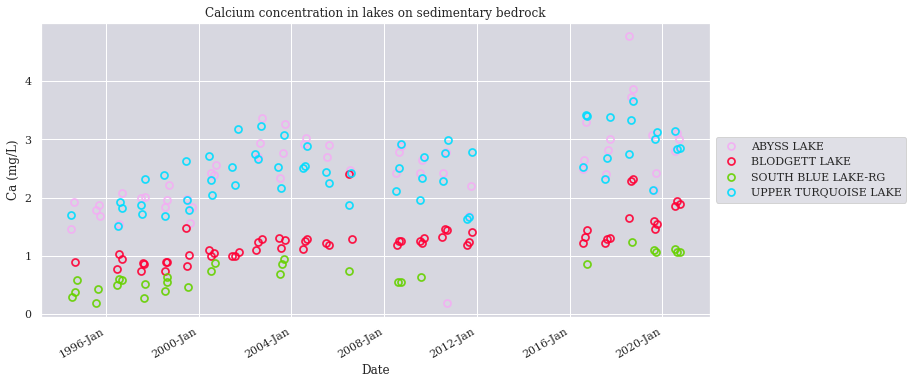
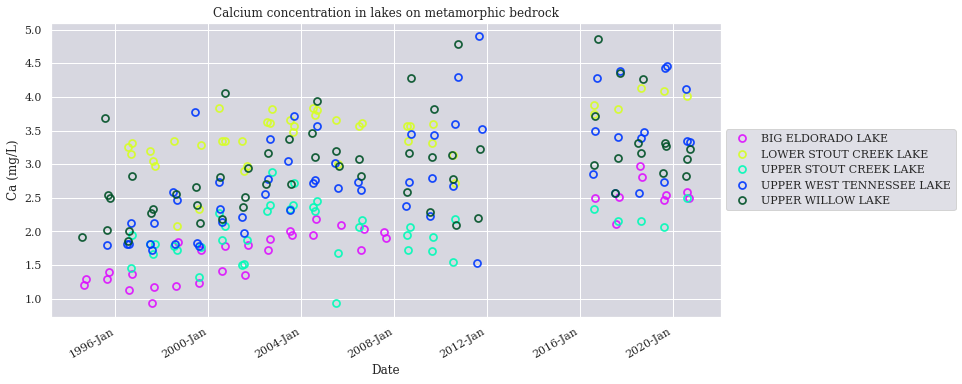
I mentioned that ions and chemical compounds can end up in lakes due to acid precipitation, but that isn't the only input source of ions in lakes. Rocks weather and break down over time, releasing minerals and natural chemical compounds in the process. Different types of rock yield different compounds at different rates. Limestone contains more calcium than granite, for instance. To determine the affect of geology on nutrient levels, I grouped the lakes in this study into the three broad categories of rock: igneous, sedimentary, and metamorphic.
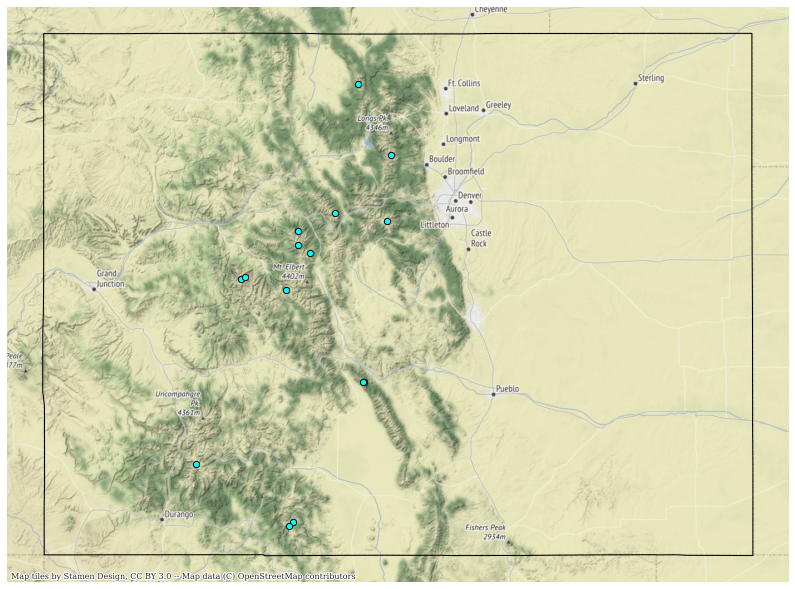
Where am I, again?
The data I analyzed are for lakes in the Rocky Mountains of Colorado. You can see their locations plotted on the map below:
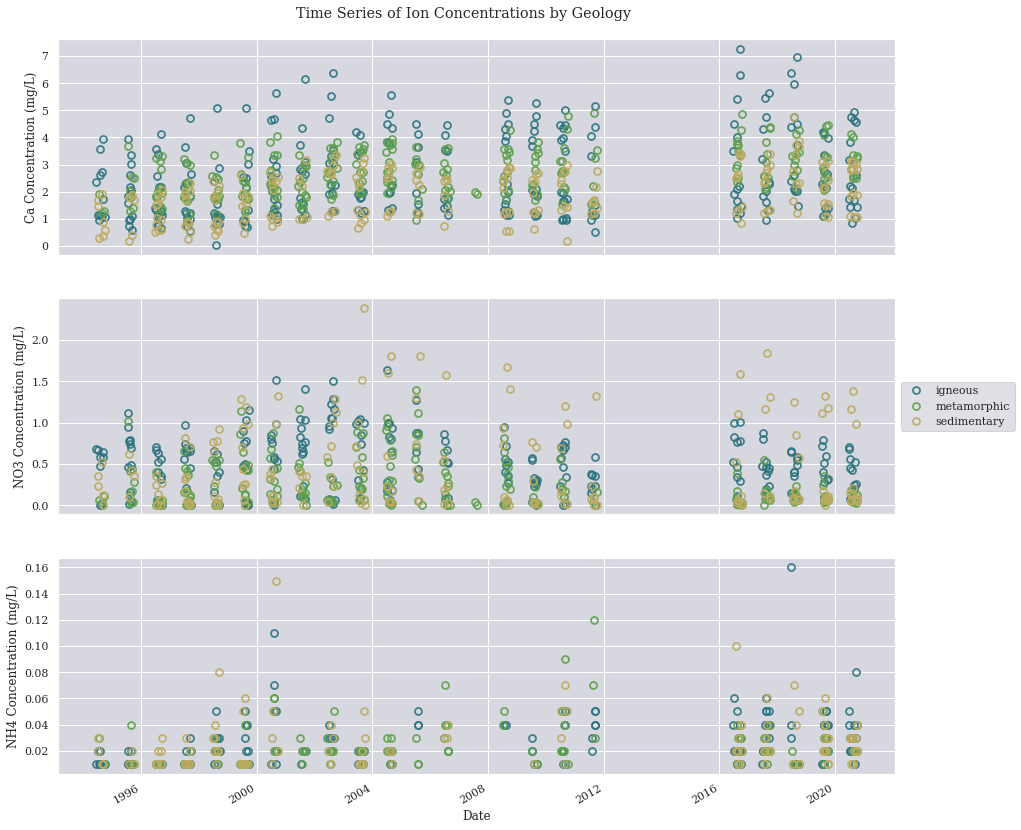
There’s something in the water!
The US Forest Service water inventory survey takes water samples from lakes throughout the Rocky Mountains and uses standard laboratory methods measure ion concentrations and water quality parameters (including pH and ANC). For simplicity, I focused on 15 lakes in Colorado, and chose to look at three of the twelve types of ions surveyed. Those three ions are: calcium (Ca+2), nitrate (NO3-), and ammonium (NH4+).
A Side Note: you may notice a gap in these data. There was a lapse in sample collection for 2012-2016. These things sometimes happen in science! Project funding may run out, a leadership transition within a lab group might occur, equipment might break down and need to be replaced, life might even be disrupted by a global pandemic! These kinds of gaps in data are unfortunate, but do not diminish the value of long-term research and datasets.
A Side Note : For the sake of time and space, I haven't included all the plots I generated for each ion and water quality parameter. However, those plots all exist and can be found in the github repository linked at the bottom of this page.
The real Loch Ness Monster!
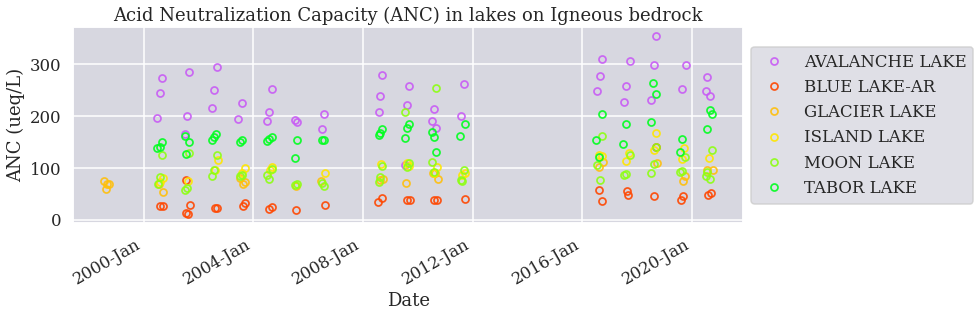
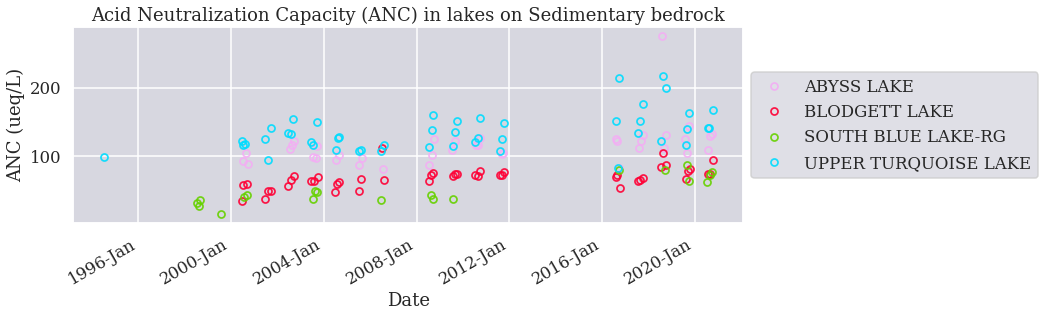
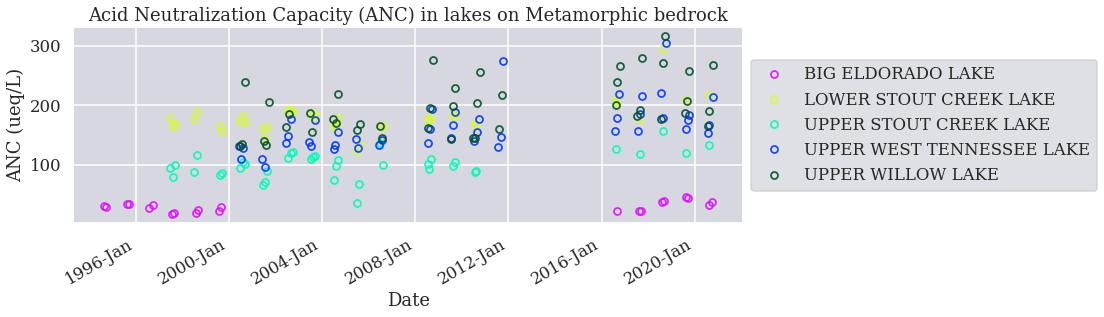
(Okay, as much as I want to believe, I'm not here to talk about Nessie. Let's talk about what is in the water, and what that means.) These graphs demonstrate a few key points:
- There is no significant difference in ion concentration among rock types.
- Ion levels in these lakes are gradually increasing over time.
- ANC is increasing over time.
and from those points we can conclude:
- Geology does not significantly affect the baseline levels of ions in lakes, so inputs must be coming from sources other than the bedrock.
- Salts, nutrients, and pollutants are gradually accumulating in alpine lakes. This may have consequences for downstream water quality, and could lead to other environmental health concerns in the future. It is important to consider what other sources are contributing to ion accumulation. Dust deposition may be introducing contaminants. Wildfires might introduce additional nutrients freed from burned vegetation and soils.
- Increased acid neutralization capacity may seem like a good thing, and while it's true that overly acidic water is not good for the environment, it is also true that excessively alkaline water is problematic.
In closing...
While it may seem that the changes in lake chemistry observed here are not yet severe, it is never too early to enact management practices to protect these sensitive water sources. And as I mentioned, there are several other environmental factors besides geology that may influence water chemsitry! This research will continue exploring what those factors and their effects may be.
Additional Resources
Hey there! Maeve here with a few more notes to the reader before I sign off. You might have noticed I use {image description} tags in addition to traditional figure captions throught this blog. I do so to improve accessibility and help people who might rely on screen readers to view and interact with my content. Here's a great resource where you can read more about why that's a good idea!
But wait! There's more!
Curious? Skeptical? Graph nerd? Just want to learn more? You're in luck! The findings reported in this blog are part of an ongoing project. You can follow progress and find future work in my github repository, where you'll also find the data workflow used to generate these plots and blog: https://github.com/MECMccormick/alpine-lake-chemistry. If you're interested in some more advanced reading and for insight as to the premise and motivation for this research, I also recommend the following paper:
Musselman, R.C., Slauson, W.L. Water chemistry of high elevation Colorado wilderness lakes. Biogeochemistry 71, 387–414 (2004). https://doi.org/10.1007/s10533-004-0369-6