Using Remote Sensing to Evaluate Green Infrastructure
Can we use remote sensing to measure benefits of green infrastructure projects in dense urban environments?
By Jensen Widtfeldt
Background
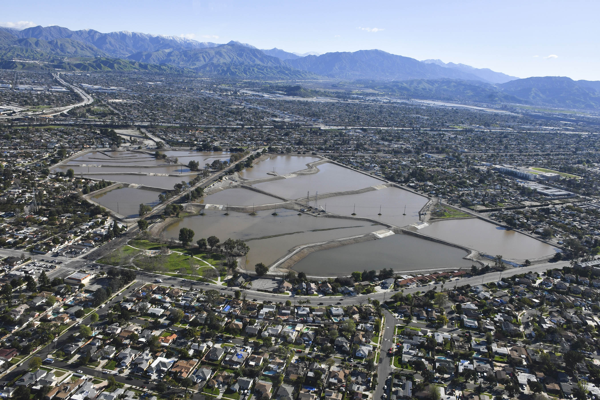
Stormwater spreading grounds are large-scale green infrastructure projects that help redirect and recapture stormwater runoff from impermeable hardscapes.
At first glance, these features may appear to have little value in the typical urban environment. They often defined by open areas with little vegetation or defining terrain features, and typically look like a patch of undeveloped of land in an otherwise well-developed urban area.
Benefits of "green infrastructure"
So why are these types of projects incorporated so frequently into many large cities? Despite their appearance, these features play a critical role in balancing the interactions between the natural and built environment, including by:
- Recharging local groundwater resources
- Flattening spikes in peak flow volumes after heavy precipitation
- Reducing pollutant discharge into local water systems
Why does this matter?
Sustainable urban development requires looking ahead at the long-term impacts that developed areas have on the natural environment.
The benefits of green infrastructure projects are becoming increasingly important as cities and urban hubs plan how to mitigate the adverse effects of climate change, particularly on water availability and changing preciptation norms, over the next century.
Goals
This analysis will help measure and validate the role of stormwater spreading grounds in the Los Angeles region through measurement of moisture level and local precipitation data.
Requirement already satisfied: utm in c:\users\jensenwidtfeldt\miniconda3\envs\earth-analytics-python\lib\site-packages (0.7.0)
Data and Analysis
Sentinel-2 geospatial data
This analysis will use Sentinel-2 HLS data, which provides multiple reflective light bands at a 30-meter spatial resolution.
Measuring NDMI
To view the impact of green infrastucture projects on stormwater capture, we will use the Near-Infared (NIR) and Short-Wave Infared (SWIR) Sentinel-2 bands to calculate the Normalized Difference Moisture Index (NDMI) of both project areas and the surrounding region.
NDMI = (Band 5 (NIR) – Band 6 (SWIR)) / (Band 5 (NIR) + Band 6 (SWIR))
NDMI is primarily used to determine vegetation water content. Ideally, these project areas will show greater effectiveness in capturing and retaining stormwater runoff through longer efficacy of saturated soils and vegetation growth post-precipitation.
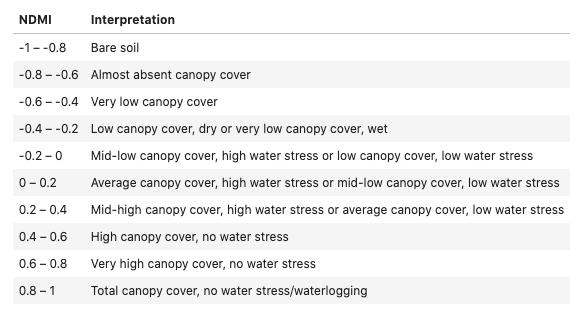
How exactly does NDMI correlate with moisture levels?
This table below shows how the NDMI measurement relates to different levels of soil saturation, vegetation, and/or water stress for a given area:
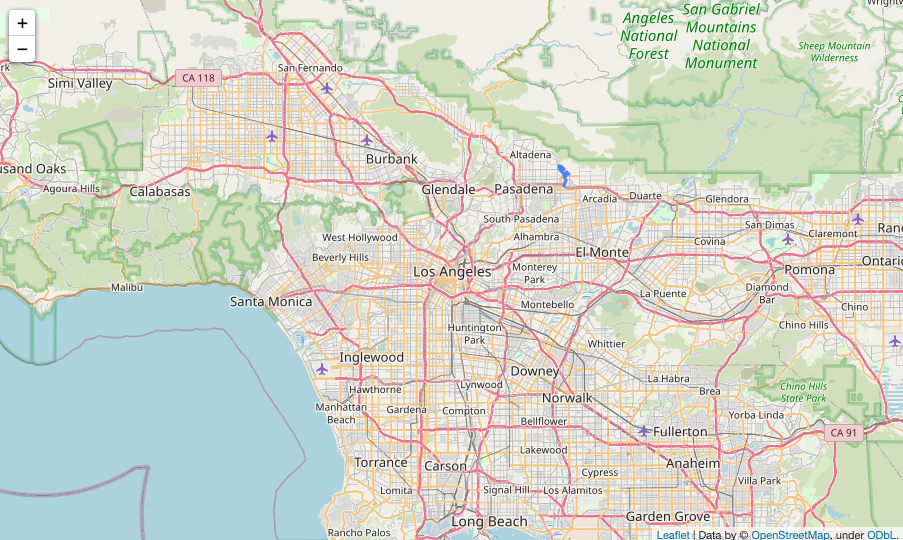
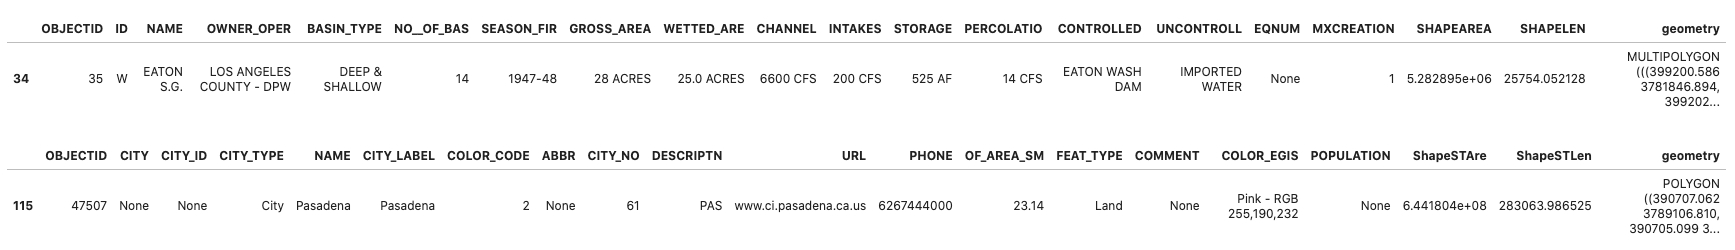
Where is our project area?
This analysis focuses primarly on the Eaton Stormwater Spreading Grounds. This stormwater spreading ground site is located in Pasadena - part of the Los Angeles metropolitan area.
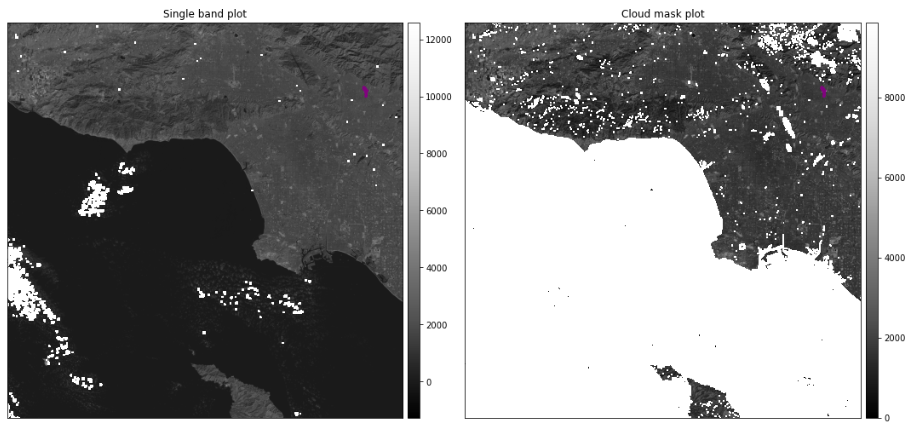
Cloud Masking
Cloud masks necessary to remove data values impacted by clouds or other atmospheric interference from satellite imagery. Sentinel-2 HLS provides an "Fmask" quality assurance (QA) band along with each data file, along with documentation on how to properly utilize different masking features.
Results
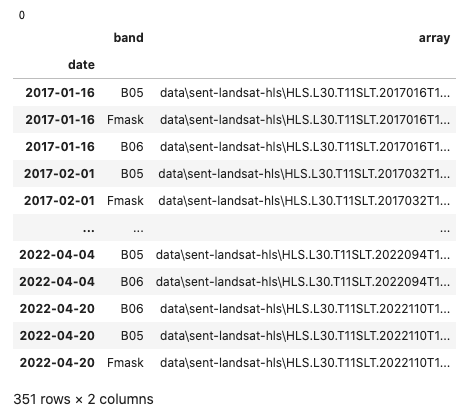
First, we create a loop to provide list of the Sentinel-2 NIR and SWIR bands, indexed by date.
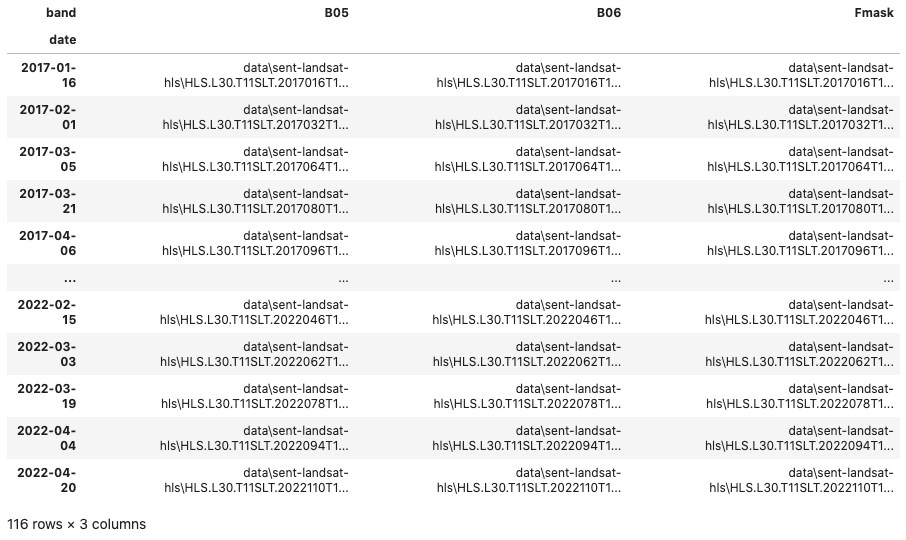
Then, we pivot the table to group the selected bands by the indexed date.
Finally, we write a loop to run through all of the NIR and SWIR arrays listed in the dataframe, open and mask any cloud interference, calculate NDMI and other key summary statistics, then place into two dataframes.
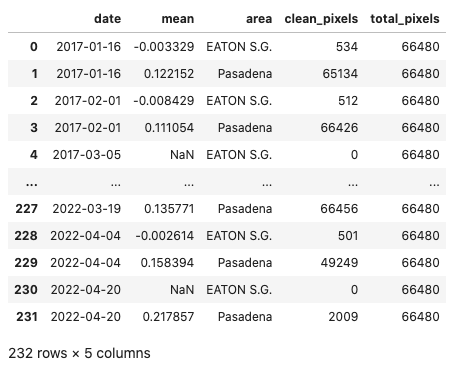
Many of the scene data are heavily obscured by clouds - some of which slip through the cloud mask function.
To catch these potential outliers, we calculate the proportion of masked pixels to total pixels and "drop" the scenes that were heavily obscured by clouds. This will limit the amount of outliers in our final data results.
Viewing the NIR, SWIR, and NDMI Arrays for both Project and Surrounding Areas
With the core loop complete, let's first put some eyes on the resulting arrays to make sure everything visually checks out before starting our final analysis.
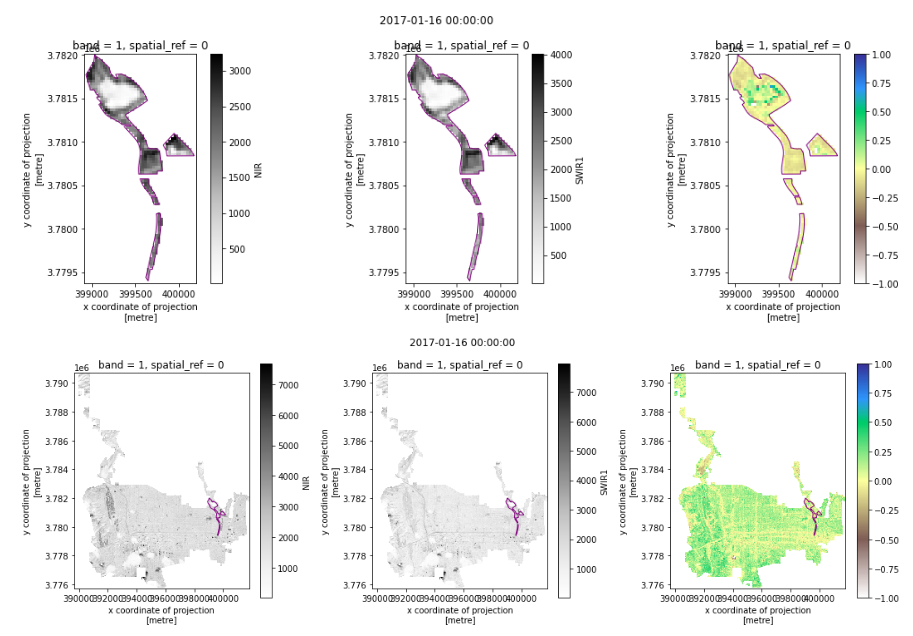
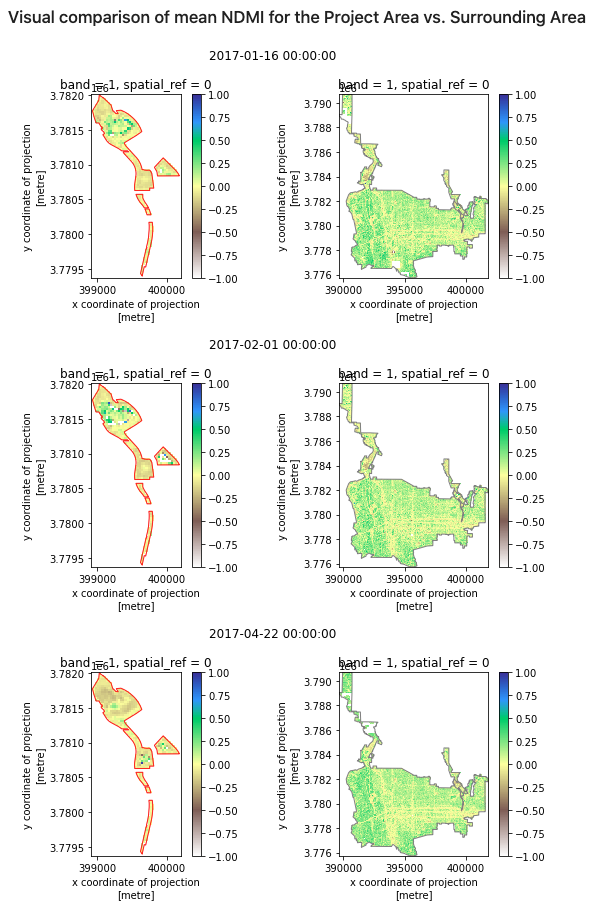
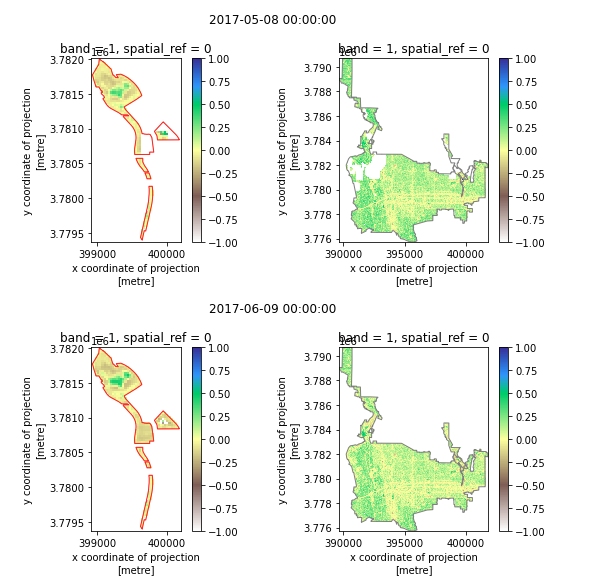
Visual comparison of mean NDMI for the Project Area vs. Surrounding Area
Adding in Precipitation Data
Lastly, we'll want to include IMERG precipication data for these same dates and project/site areas to see how the NDMI measurements correspond with precipitation volume.
C:\Users\JensenWidtfeldt\miniconda3\envs\earth-analytics-python\lib\site-packages\xarray\backends\plugins.py:61: RuntimeWarning: Engine 'rasterio' loading failed:
(python-dateutil 2.8.0 (c:\users\jensenwidtfeldt\miniconda3\envs\earth-analytics-python\lib\site-packages), Requirement.parse('python-dateutil>=2.8.1'), {'pandas'})
warnings.warn(f"Engine {name!r} loading failed:\n{ex}", RuntimeWarning)
While our subsetted data from GES roughly around the LA region, we'll want to make sure we select the areas that are as close as possible to the centeroid of the shapefiles for both project and site areas.
Time-series comparison of mean NDMI values
Finally - let's put the data together in full and analyze the results!
NDMI Arrays
However, looking at the mean NDMI only can be decieving. For one, taking the mean value of a large sample size also ends up "normalizing" some of the high and low variance results - particularly in the case of the city of Pasadena where the sample size is so large!
To observe the full impact of these precipitation events, let's look at all NDMI values from each scene's arrays:
Findings
The comparison of mean NDMI between the Eaton Stormwater Spreading Grounds and surrounding Pasadena area uncovers a few interesting data insights:
- The urban area surrounding the stormwater spreading grounds has a higher mean NDMI throughout the year
- This is likely due to the fact that the city of Pasadena (like most urban & residential areas) has lots of irrigated vegetation - residential lawns, commercial landscaping, tree-lined streets, and greenspaces like parks all make an impact!
- Conversely, the Eaton Spreading Grounds is mostly comprised of bare earth and sparse vegetation. It makes sense for these mean NDMI values to be lower - especially in an arid region like Los Angeles!
- The stormwater spreading grounds appear to have greater variability - particularly in response to precipitation events
- The rainy seasons in the winters of 2017, 2019, and 2020 all show steep spikes in mean NDMI for the Eaton Spreading Grounds
- Pasadena's variance in NDMI appear to be more correlated with season, while Eaton Spreading Ground's variance seems to be more directly correlated to precipitation response
- This is likely a result of the Eaton Spreading Grounds receiving an deluge of stormwater from surrounding urban hardscape during these storm events - which is then recaptured into local groundwater resources!
- Overall, NDMI may be imperfect for adequately measuring stormwater capture for urban green infrastucture projects
- Sentinel-2 data was chosen for it's high spatial resolution (30m) in order to measure projects within an urban environment.
- However, NDMI is best suited for measuing vegetation-related moisture rather than soil moisture levels.
- A more specific soil moisture measurement like SMAP would provide better direct correlation to the ability of stormwater spreading grounds to capture and reclaim groundwater resources, but it has too low of a spatial resolution to gather effective data for all but the largest types of stormwater spreading grounds
- NDMI can provide some insight, but catches results from many other moisture-related variables (particularly from vegetation) that may skew the intended analysis
Data Sources
- Sentinel-2 HLS Data: https://search.earthdata.nasa.gov/search
- GES Precipitation Data: https://search.earthdata.nasa.gov/search
- City of Los Angeles Open Data: https://data.lacity.org/
- City of Los Angeles GeoHub: https://geohub.lacity.org/