Sensors and Sunlight: How We Can Identify Plant Species From Space
Hyperspectral Variation at NEON Sites
By Rachel Michaels
Background
How is identifying plants without seeing them even possible?
The type of light that we as humans can see is called visible light, and this light is what brings color to our world. It's what makes the ocean look blue or the grass green. Everything on Earth absorbs and reflects light, including plants, but the amount that is absorbed and reflected varies from object to object. Plants, for example, are green because the majority of the light they reflect is green light. They reflect lights in other colors as well, but they mostly absorb them. However, all plants are different. Let's say the light that plant A is reflecting is 95% green light and 5% blue light, whereas plant B is reflecting 85% green light and 15% blue light. Specialized field equipment can be used to determine what type of light a plant is reflecting and how much of it. Similarly, these measurements can be made on a larger scale by flying sensors that also measure how much of each light type is reflected over the Earth's surface, and we can make determinations of what plant species are where by combining these data. This is the end-goal of the project on which I'm working using data obtained by the National Ecological Observatory Network (NEON), and my part is to create a reproducible analysis to start working toward that goal.
Where is NEON data collected?
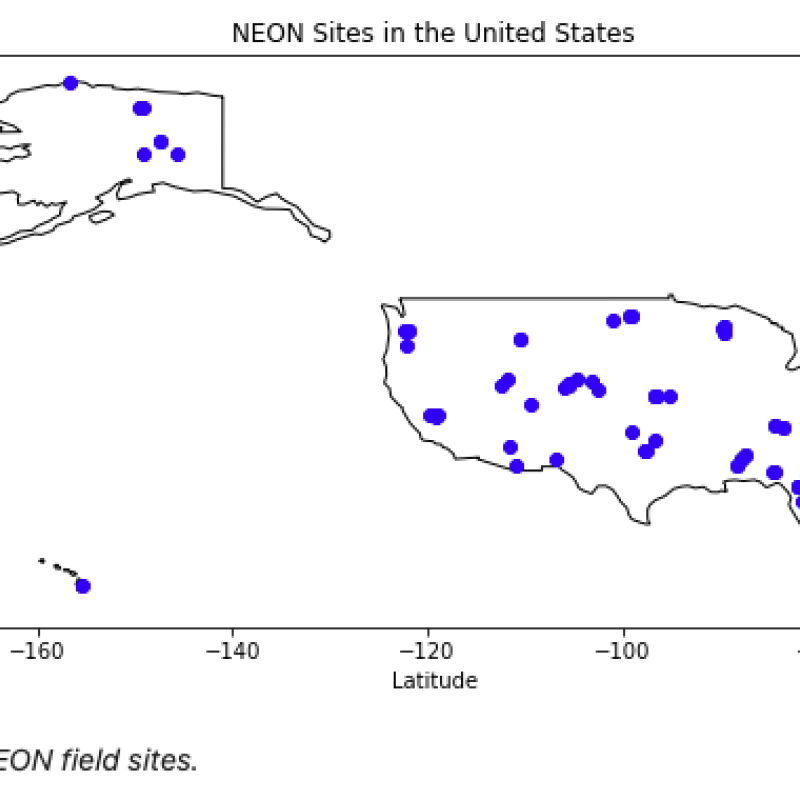
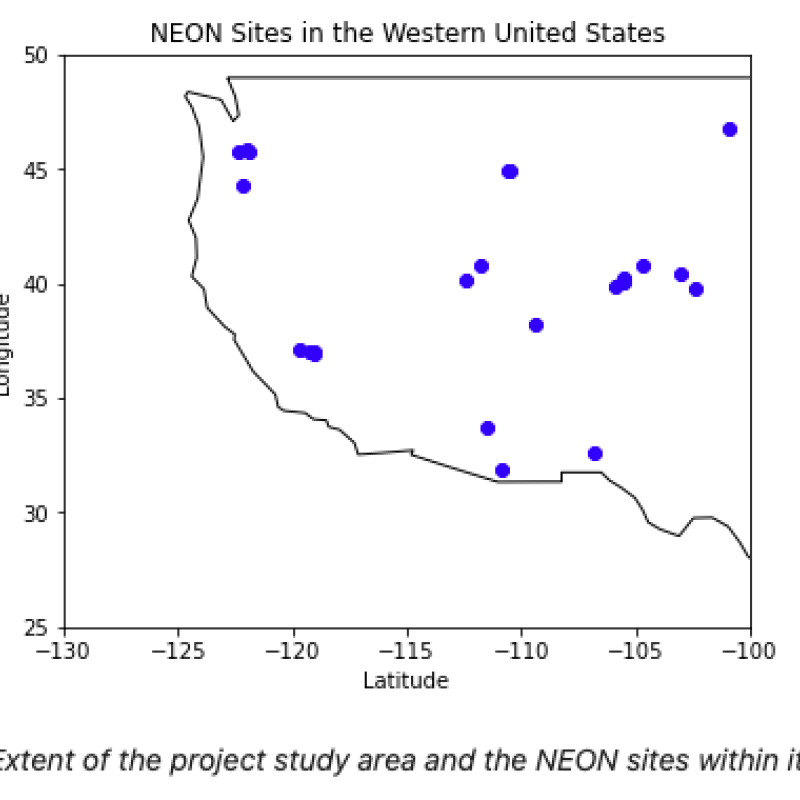
NEON data is collected at 81 sites located throughout the United States (shown in the first image below), but my analysis is being created with the sites in the western United States in mind (shown in the second image below). However, the analysis can be used for any NEON site where plants grow.
Data Application
How exactly will your analysis help identify plants?
The reproducible analysis that I am working on for my project will allow users to select NEON sites of interest by filtering NEON sites by site characteristics and location. The extent of the project area is the western United States; however any four coordinates can be used to form a polygon that will return the NEON sites located within it. Further, users can filter by site characteristics such as if non-neon research is allowed, average number of green days per year, soil type, field site type (e.g. terrestrial or aquatic), along with other characteristics. Once sites of interest are known, the analysis will also report the dates when reflectance data was collected and is available for the filtered sites, request the reflectance data, process the reflectance data, and plot the reflectance data. Plotting the data and being able to visualize it will allow researchers to make decisions regarding when sampling should take place.
What does reflectance data look like?
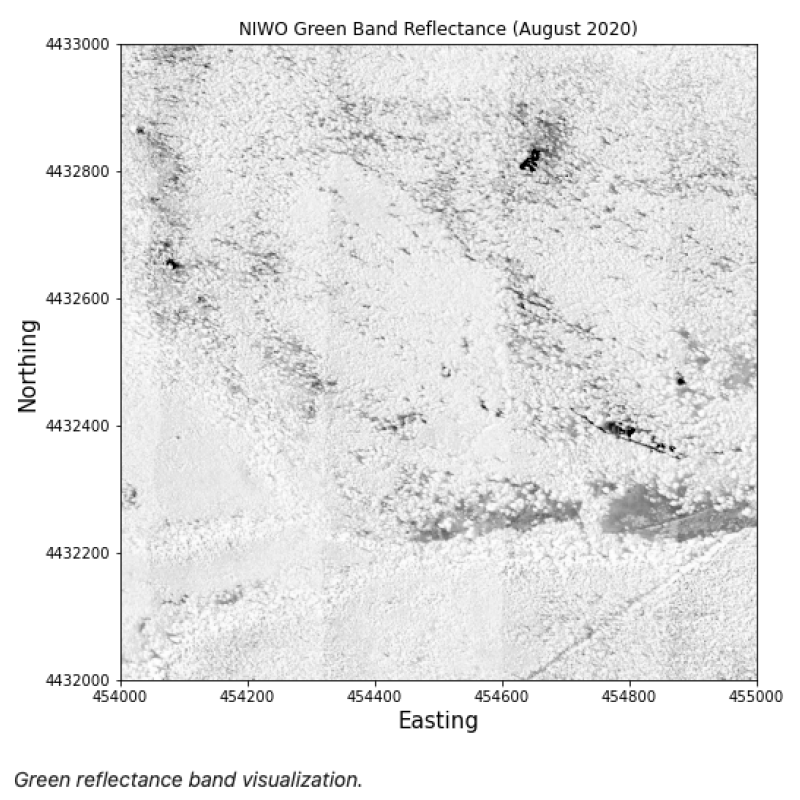
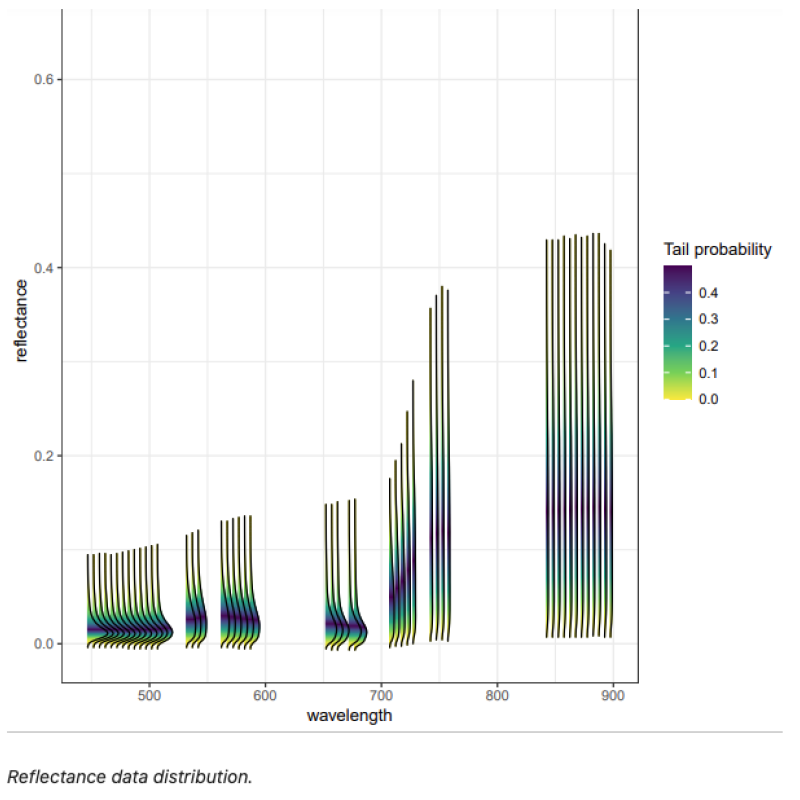
Light occurs at different wavelengths. It's measured in nanometers (nm), and humans can see some of it, but not all of it. It's that visible light that brings color to our worlds, and it exits at the wavelengths that occur at or between 380 and 700 nm. The first image below is a representation of the wavelengths we can and cannot see. There are 426 data points, and each point represents a small range (5 nm) of wavelengths and the average amount of light being reflected at each point. The boxes are the wavelength ranges that are captured by a drone-mounted-sensor that will be used for data collection. It's a sensor that only picks up certain wavelengths as opposed to the aerial platform sensor that collected all of the wavelengths in the figure. This project aims to create a workflow that analyzes the wavelengths within the boxes. The second image is the data that was collected by the aerial platform sensor at wavelength 566.9639, which is within the range of wavelengths where green light occurs. This is the green light that is being reflected.

Current Findings and Future Work
So what did you find?
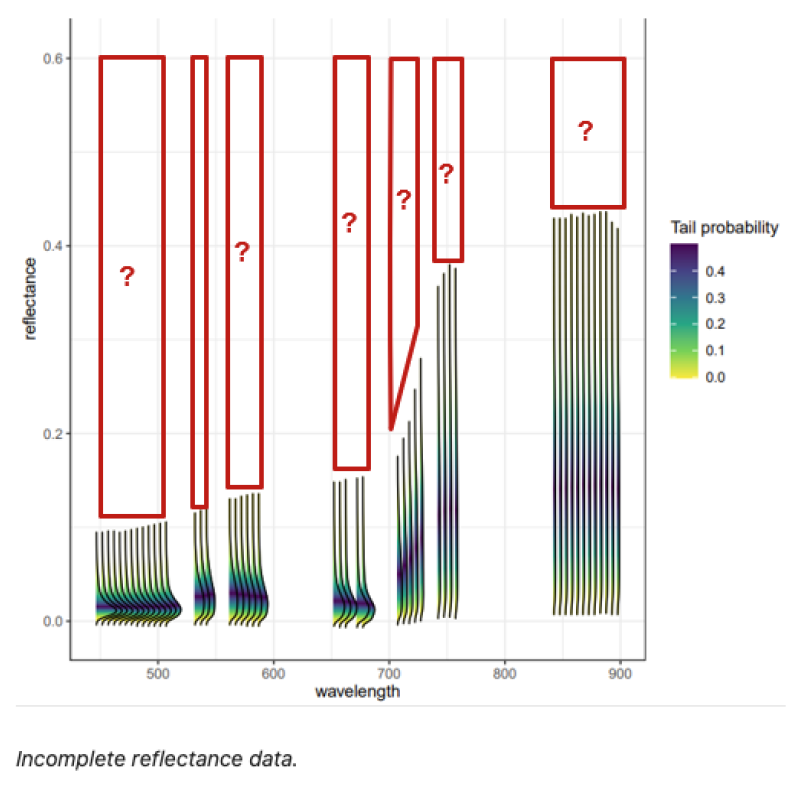
We were able to plot the distribution on reflectance data for one area of one site in one point in time (below image). Achieving this means that this can be reproduced for other areas, other sites, and other points in time. By looking at the data, we can see the amount of it that was not captured during sampling (second image below). This indicates that this area needs to be sampled additional times so that data can be captured for the missing areas in the second image below. This missing data may be captured at different point in time, as reflectance data will vary depending on the time of year. This is critical to accurately identifying plants.
How did you do this?
The analysis will allow users to do the following:
- Select NEON sites of interest by filtering sites by site characteristics and location.
- Report the dates when data was collected and is available for the filtered sites.
- Request the data.
- Prepare the data for plotting.
Why does it matter?
This reproducible analysis is the project's preliminary work, so it is laying the groundwork for future steps taken toward the project's end-goal. Although some research has indicated difficulties using this approach to determine the number of plant species occurring in an area (Rocchini et al., 2007), more recent endeavors in this field have proved successful for identifying plants such as those that are medicinal (Khdery & Yones 2021), invasive (Paz-Kagan et al., 2019), and rare (Cerrejón et al., 20211) via sensory technology.
What's next?
Beyond the creation of this analysis, future work will involve analyzing the plotted data between different spatial and temporal points to determine when and where sampling should be conducted to capture as much data as possible.
Resources
Additional Information
Visit https://github.com/rami8797/macrosystems_spectral_variance for more information regarding this project.
Citations
Data used to produce figures was made available by the National Ecological Observatory Network (NEON).
Cerrejón, C., Valeria, O., Marchand, P., Caners, R. T., & Fenton, N. J. (2021). No place to hide: Rare plant detection through remote sensing. Diversity and Distributions, 27(6), 948-961.
Khdery, G., & Yones, M. (2021). Innovative spectral library for identification common wild plants using hyperspectral technology in Northwestern Coast, Egypt. The Egyptian Journal of Remote Sensing and Space Science, 24(3), 485-491.
Paz-Kagan, T., Silver, M., Panov, N., & Karnieli, A. (2019). Multispectral approach for identifying invasive plant species based on flowering phenology characteristics. Remote Sensing, 11(8), 953.
Rocchini, D., Ricotta, C., & Chiarucci, A. (2007). Using satellite imagery to assess plant species richness: The role of multispectral systems. Applied Vegetation Science, 10(3), 325-331.