We are losing more even as we know more
Damage from natural hazards is increasing despite the growing ability of the geosciences to delineate where and when extreme events will occur. We show that decades of risky development has increased exposure to the most damaging natural hazards.
Assessing where two geographies intersect: hazards and development
We mapped “hotspots” of occurrence and magnitude of the most damaging hazards -flood, earthquake, hurricane, tornado, and wildfire- over the contiguous U.S. (CONUS) at 250m x 250m grid cells. We defined hotspots for each natural hazard as grids where the occurrence or intensity of the hazard exceeded the 90th percentile among all CONUS grids.
We used a unique dataset of over 350 million structures (homes, apartments, shops, offices, etc.) obtained under a data-sharing agreement with the Zillow Group, Inc., to identify where people live, work and recreate, and estimate trends in development.
Analyzed together, these two datasets reveal the extent, pattern and trend of hazard exposure in CONUS.
Hazard exposure has increased since 1945
Over half (57%) of the structures extant in 2015 were built in hazard hotspots for earthquake, wildfire, flood, hurricane, and tornados even though these hotspots cover only 31% of the contiguous U.S.
Exposure has grown in all hazard hotspots over the last 70 years
- The number of structures in hurricane and earthquake hotspots increased faster than the national average growth, and the density of structures in these two hazard hotspots is currently larger than the national mean (3.1 and 1.7 times larger, respectively).
- Trends in structure density in tornado hotspots roughly parallel national values.
- Growth in flood and wildfire hotspots, while still positive, fall below the national trajectory.
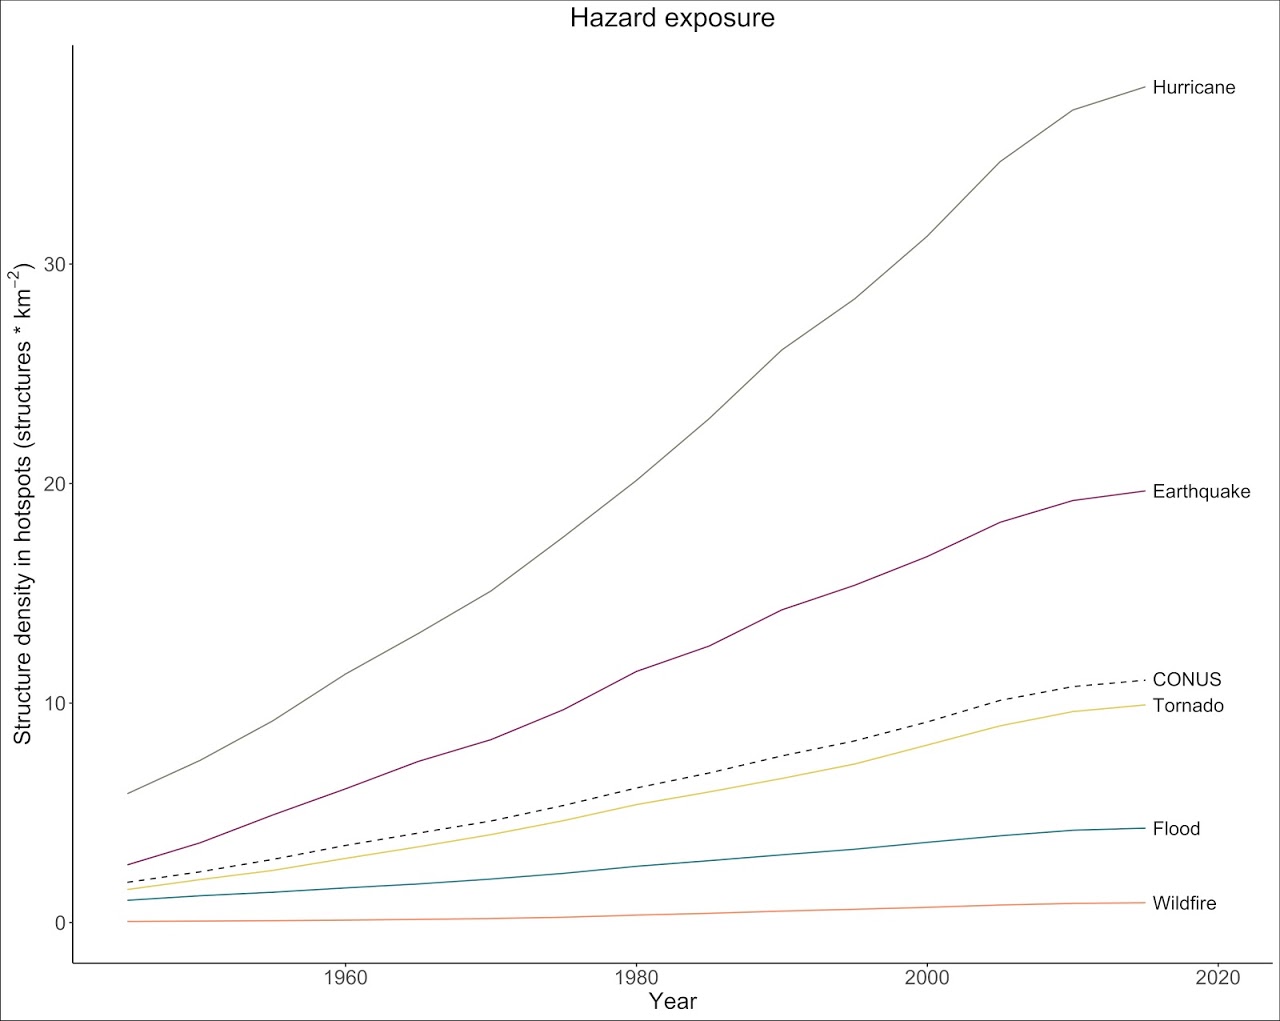
Figure 1: Demonstration of increasing levels of human density in hazard hotspot locations over time.
Current exposure has come from both densification and expansion of built-up areas
Temporal trends in densification vary with hazard.
- In earthquake, hurricane, tornado and flood hotspots, densification was relatively rapid prior to ~1970.
- In wildfire hotspots, densification has steadily increased, suggesting that denser settlements have incurred into wildfire zones but also that low-density development in the wildand-urban interface has tended to fill in over time, an especially worrying pattern.
Expansion rates in CONUS show two historical inflexions
- Similar to the national trends, expansion in tornado, earthquake and flood hotspots decelerated in the 1980s and again in the 2000s.
- Hurricane hotspots featured the highest and fastest expansion, as suburbanization of the coastal plain occurred at twice the national rate.
- Expansion in wildfire hotstpots was very low until the mid-1970s, and increased thereafter.
View our AGU poster here.
Funding for this work was provided by Earth Lab through the University of Colorado Boulder’s Grand Challenge Initiative; NSF’s Humans, Disasters, and the Built Environment program (award #1924670 to CU Boulder); the Innovative Seed Grant program at CU Boulder, and the Eunice Kennedy Shriver National Institute of Child Health & Human Development of the National Institutes of Health (award # P2CHD066613).
Featured Blogs


Funders