Calibrating Low-Cost Air Pollution Sensors Using Machine Learning
Improving low-cost sensors by aligning them with statistics
The Rise of Low-Cost Sensors
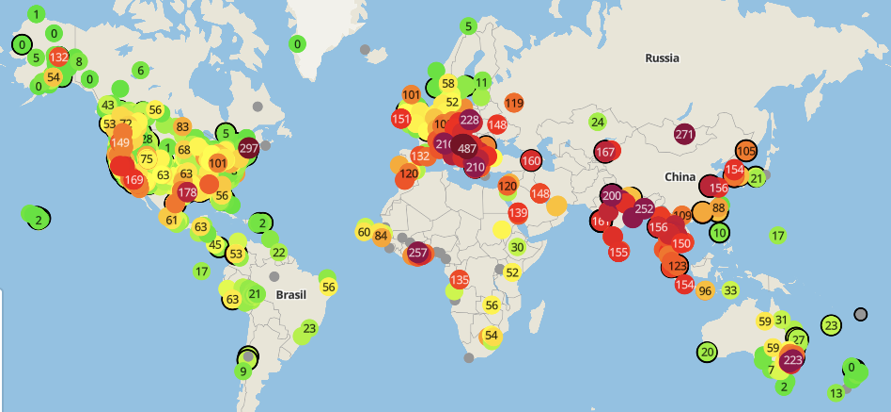
Air pollution measurements are often reported as 24-hour averages, with relatively few monitors from federal and state agencies dispersed over large areas. Especially in the western U.S., there is sparse coverage of air pollution monitoring (see my blog post about mathematically modeling air pollution over the western U.S.). This sparse coverage in time and space (few data points over time, and few locations where data is being taken) makes it challenging to quantify how much air pollution people are exposed to, which in turn can frustrate health research and policy-making attempts.
In recent years, there has been a push for low-cost sensors to supplement data from high-cost sensors deployed by government agencies (such as federal reference method (FRM) and federal equivalence method (FEM) monitors deployed by the U.S. Environmental Protection Agency (EPA)). Networks of low-cost sensors can help provide air pollution measurements at more points in time and space. A well-known example is the growing network of Purple-Air sensors. These are low-cost sensors that report measurements of airborne particulate matter in real time. As of the end of 2019, there were more than 9,000 Purple-Air II sensors worldwide . (There are also many other low-cost sensors available for research purposes across the world, but Purple Air is one of the best-known commercial products.)
Love My Air, Denver
In 2018, the Denver Department of Public Health and Environment (DDPHE) was awarded $1 million by the Bloomberg Philanthropies’ Mayors Challenge to deploy a network of low-cost airborne particulate matter sensors across the city. This network consists of Canary-S sensors developed by the company Lunar Outpost. The plan is to use the resulting data in public health warnings and environmental health education. This project has recently been named the Love My Air program. As of fall 2018, DDPHE had deployed nine low-cost sensors: four at elementary schools and five collocated with EPA FEM monitors. As of this writing in fall 2019, they have installed ten more, and plan to install another ten in 2020. A few interesting details are that the low-cost sensors in the Love My Air network are solar-powered and upload measurements to the DDPHE website using cellular data.
My mentor Colleen Reid and I began collaborating with DDPHE to investigate the effectiveness of using the air quality measurements from their sensor network in a study of childhood asthma in Denver Public Schools. Before starting the health analysis, however, DDPHE requested our help in calibrating their low-cost sensor network.
One of the challenges with using low-cost sensors is that they are often less accurate than more expensive sensors. Over the last decade, many studies have shown that it is possible to make measurements from low-costs sensors more accurate by using statistical methods. When calibrating low-cost gas sensors, researchers have used everything from simple linear regressions to machine learning algorithms including neural networks and random forests. For calibration of low-cost particulate matter sensors, however, we found no papers attempting to use machine learning techniques. Another challenge posed by low-cost sensors is that they may degrade over time, so calibration algorithms trained on past data may become inaccurate. Some studies have demonstrated the effectiveness of periodically updating calibration models using training data from the last x weeks, x being optimized for each sensor network.
To help make the air pollution data collected by the low-cost DDPHE sensors more useful in applications including research, policy-making, public warnings, and community education, we took a dual-pronged approach. First, we developed a calibration model for long-term archived data (i.e. all the data that DDPHE collected during the 2018-2019 school year). Then, we developed a calibration model for data collected on-the-fly (in real time). The long-term calibration model will be used to make DDPHE’s archived records more accurate, whereas the on-the-fly calibration will be used to inform public communication of particulate matter air pollution, especially at the schools with these monitors.
Calibration Methods
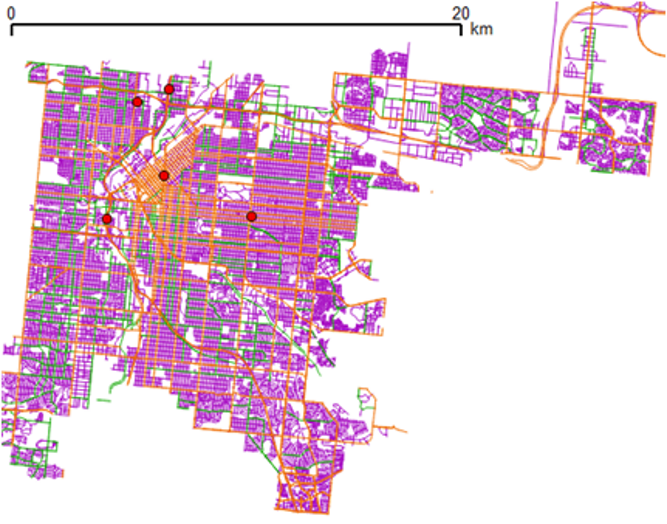
For both calibration analyses, we investigated using linear models, linear mixed-effect models, and random forest (machine learning) models using measurements of PM2.5 (airborne particulate matter), temperature, and humidity from the low-cost sensors, hour of the day, month, a weekend indicator, and the total length of various road sizes (large, medium, and small roads—see Figure 2) within various distances of each sensor location (i.e. radial buffers of 50, 100, 250, and 500 meters). For the on-the-fly analysis, we also calculated the optimal timespan of training data and testing data for each model (e.g., eight weeks of training data to calibrate the next two weeks of testing data, versus three weeks of training data to calibrate the next week of testing data).
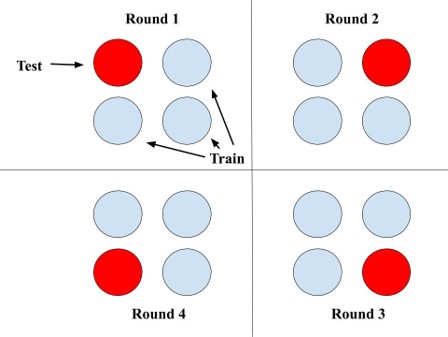
Another important component of our methodology was robust spatial and temporal cross-validation to evaluate each model. We used a leave-one-location-out (LOLO) approach to validate our models on the training data set (measurements from the five collocated sensors deployed during 2018-2019 academic year), and then tested on a completely held-out test set of measurements from two sensors in different locations deployed in fall 2019. This LOLO cross-validation approach helped us to approximate the accuracy of our calibration models on data from sensors in different locations and at different times.
Calibration Results and Discussion
In the long-term calibration, the best model turned out to be a random forest model with all the time-varying variables and the total length of large roads/highways within 500 meters of the sensor location. In the on-the-fly calibration, the best model was a multiple linear regression using the past eight weeks of measurements of PM2.5, temperature, humidity, and the total length of large roads/highways within 500 meters of the sensor location to calibrate the next week of PM2.5 measurements.
A limitation of this study is that we needed to manually remove measurements from days when it snowed because this tended to throw off the PM2.5 measurements in the sensors. Future work will be needed to automate identification of all outlier points (when the sensors are malfunctioning, such as during snow events) and improve these low-cost sensors’ performance on days with low temperatures and high humidity.
Conclusion
The calibration models developed in this study will be used in DDPHE’s online data-reporting system and to inform our research team’s future health analysis. Also, we hope that our methodology can help to guide future implementations of similar networks of low-cost air quality monitors in other cities.
Sources
https://www.atmos-meas-tech-discuss.net/amt-2019-396/amt-2019-396.pdf
Lunar Outpost “Canary-S” equipped with a Plantower 5003 sensor
https://www.atmos-meas-tech.net/12/903/2019/amt-12-903-2019.pdf