Crop Yield Forecasting with Landsat Imagery
A general spatial approach to predicting crop yield for broadacre cropping with cloud processing of remote sensing imagery.
Background & Methodology
Dryland winter cropping refers to the cultivation of crops such as wheat, barley, canola, lupins, and pulses which are not irrigated and are dependent on rainfall from late-Autumn through Winter. This model will test the relationship between vegetation indices and crop yield from 1989 to 2020. There has been a growing field of academic research on correlating these variables at the paddock, local and small regional level such as this paper, but not allot that attempts to predict for large volumes of land cover, such as the larger regional or state level.
With open-source programming and cloud computing technologies becoming more accessible, I was motivated to attempt a general remote sensing approach to the question: how well can we predict the next harvest for a whole state from 6 + months out? Because of both systemic long-term climate change and increasing frequency of severe weather events (bushfires, flooding, drought), being able to predict crop yield earlier in the winter season is becoming more commercially and environmentally important.
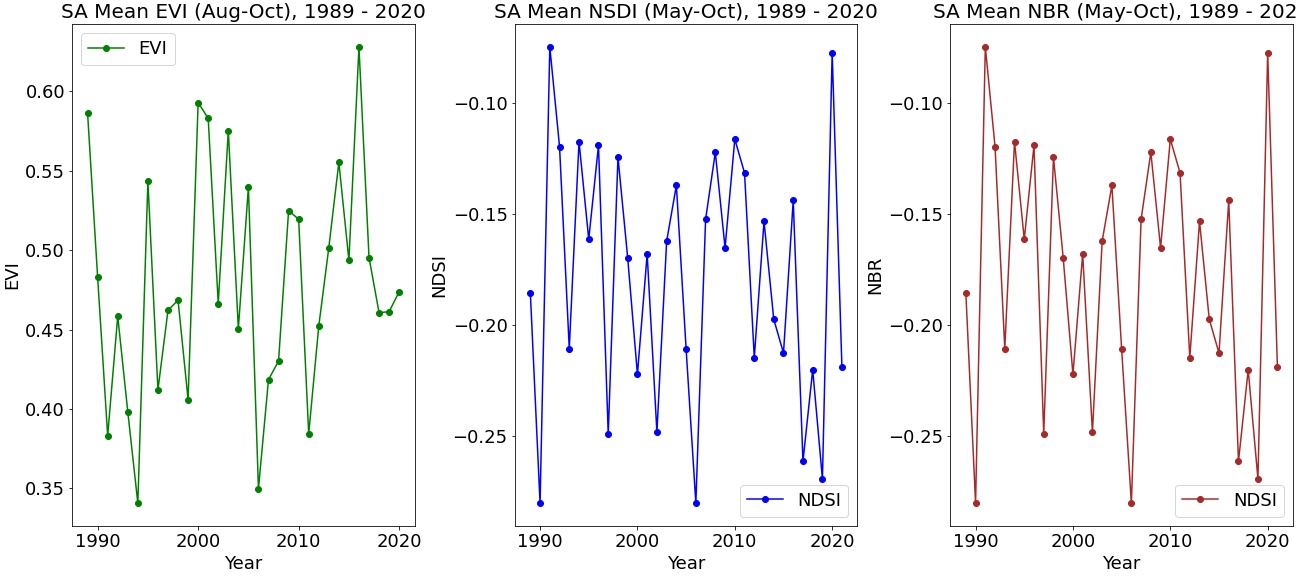
The model tests a the relationship between both EVI (Enhanced Vegetation Index) and NDVI (Normalized Difference Vegetation Index) to test for the best vegetation model fit, then tests other spectral variables, NBR (Burn Ratio) and NDSI (Snow Index) into the model to see how closely a multiple regression model predicts to current published estimates for the AOI 2021 harvest.
To access the data in this blog, and for instructions on how to set up the environment, clone the repository and run the model, visit the project GitHub page
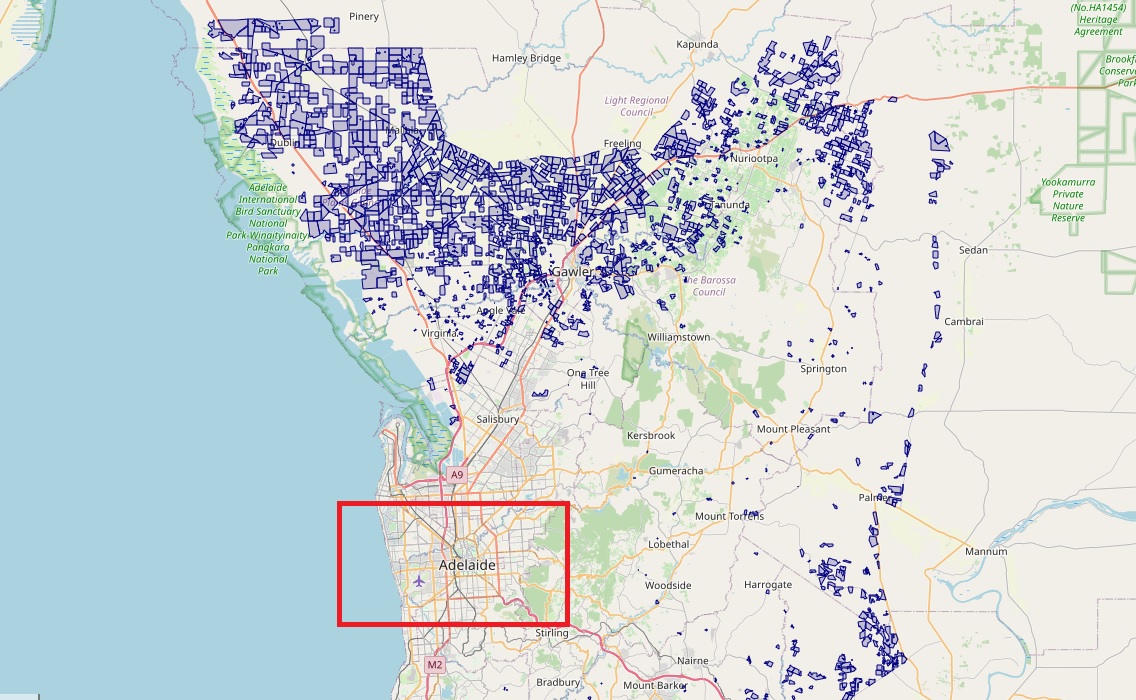
Area of Interest
The area of interest for this project is South Australia (SA), which I have used for this test case due to the quality of land cover data provided by the SA state government which breaks out the farmland polygons by cereals and oilseeds.
Dryland agriculture contributes around AU$18 billion in gross value added to the South Australian state economy with wheat contributing around half of that at around AU8-9 billion.
With over 92% of South Australian dryland cropping made up of cereals (wheat, barley, triticale), it serves as a good test case for this model, reducing noise from other crop types being rotated in each year.
Data Sources
Google Earth
The remote sensing data which is used in this model is sourced from Google Earth Engine (GEE). I have chosen to use this python API due to the speed and potential to process a large volume of imagery in the cloud over the 30-year study period. The code creates 2 collections, Landsat 5 data from 1989 to 1999, and Landsat 7 data from 1999 to 2020.
In the repo the custom functions and workflow can be found in earth_engine.py.
ABARES
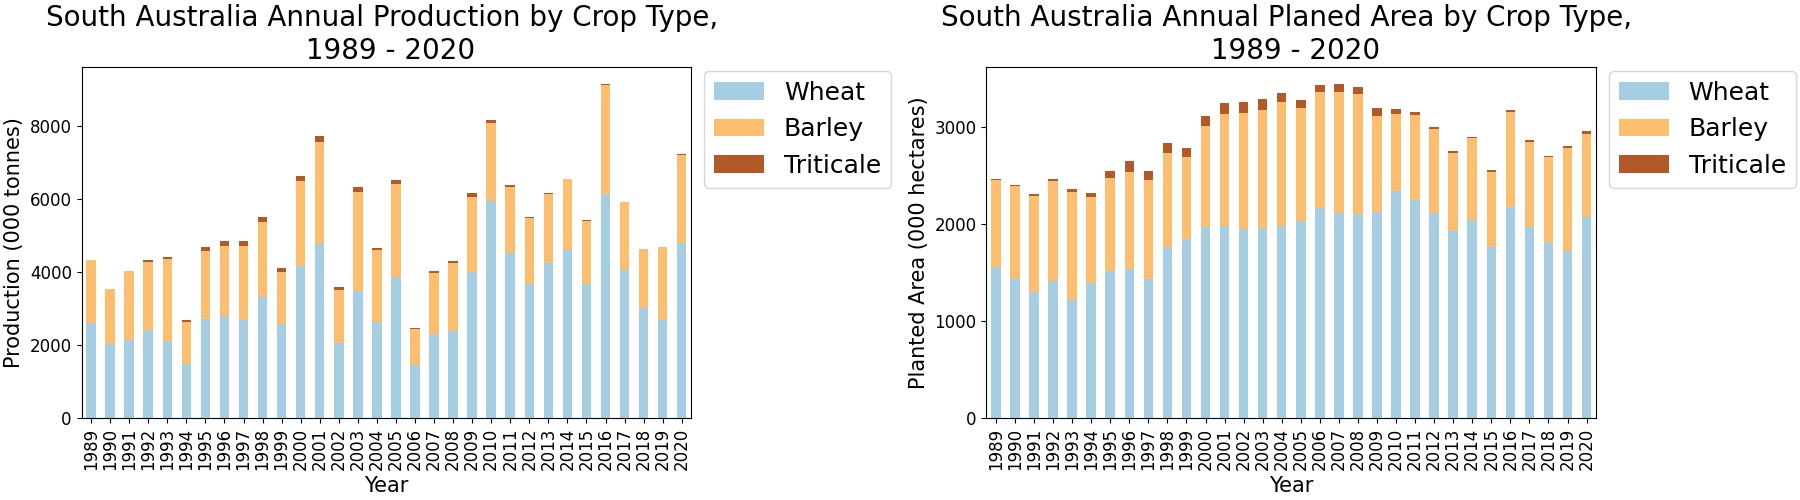
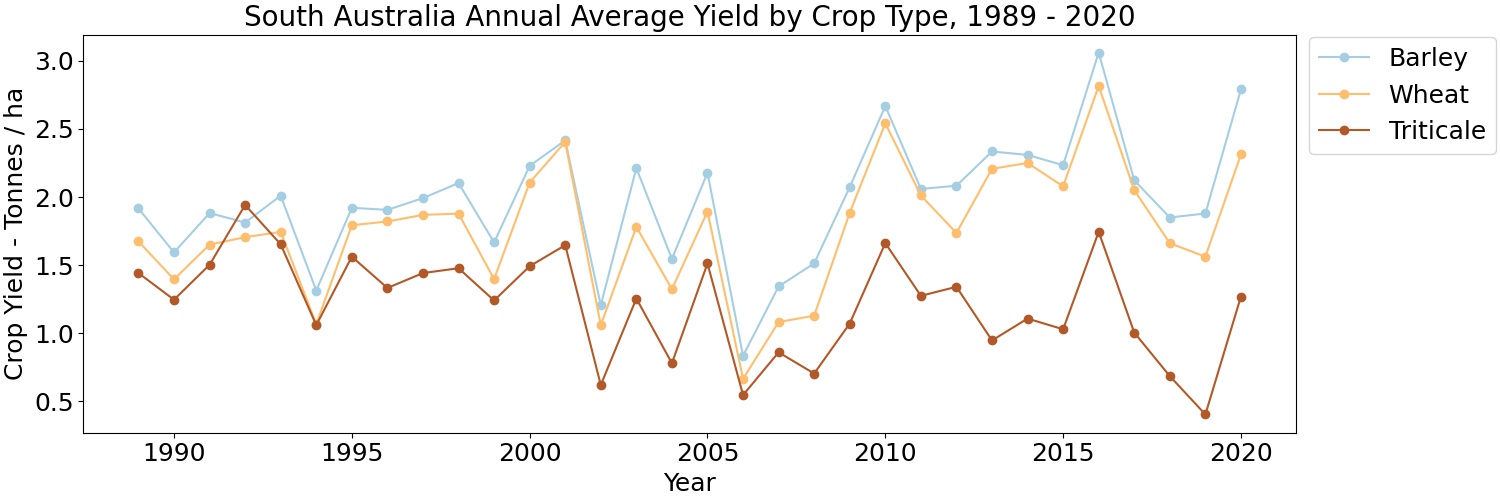
The Australian Bureau of Agricultural and Resource Economics and Sciences publish annual production and area planted data for all states and crops. This is the data I will use as the historical actuals to calculate yield (yield calculated as production / hectares planted).
In the repo the workflow for downloading, wrangling and formatting the ABARES data can be found in model_data_setup.py.
Once the feature extraction and formatting of the raw excel data is complete, we can visualize the historical data using the python plotting libraries.
Methodology
The model aims tests the relationship between EVI & NDVI values over the key months of August, September, and October with final harvest crop yield. The model is a linear regression model which uses vegetation index as the exogenous variable (X variable) to predict crop yield (Y variable).
The model is expressed as a standard linear regression equation.
y=a+bx+error
where:
a is an intercept, and
b is a slope
Findings
The regression model findings show that EVI correlates to yield at a R2 of 0.434 and p value of 0.04E-05 meaning we reject the null hypothesis and accept the alternative hypothesis that there is a relationship between the EVI and Cereals Yield. EVI (Right) was shown to perform better than NDVI (Left), with NDVI showing a weak relationship to yield at 0.19 R2 and P value of 0.01.
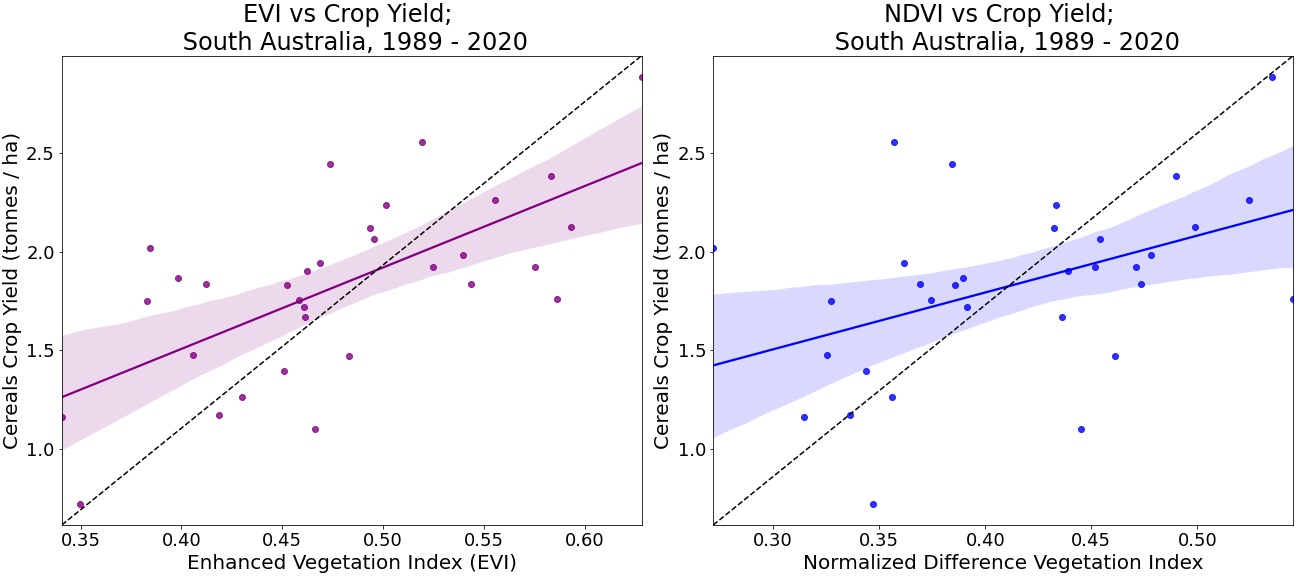
The correlation over the 30-years for SA is however not strong enough for a robust predictive model, hence the key takeaways are:
- There is a relationship between NDVI/EVI and crop yield that can be examined further at different geographical scales to test for greater predictive value.
- There is a case to explore more modelling methodologies to test this hypothesis using more data inputs and different programming techniques.
- This modelling technique can be used for a high-level direction of what range yield is likely to fall in, but the predictive value is not high enough to be considered a basis for prescriptive actions.
Testing as a Multiple Regression Model including NDSI and NBR
The next step I took was to test all three spectral indices up to May to examine how well we can predict the next harvest 6 months ahead. We can compare the results to published estimates from the CSIRO and ABARES to see how close this model estimates. Because we are only using the first 2 months of the winter season to build the model, we can expect a low R2, but it is worth checking how it passes vs. the published estimates for 2021.
Interestingly, despite a very low R2, the model predicts within a close range of the two key published forecast sources from the Australian Government. It is accepted that it is largely unrealistic for a prediction made in May to be truly reflective of what the Oct-Mar harvest will yield, however it provides a good starting point to start tracking through to the year to September as more data comes available and the strength of the correlation improves.
| Publisher | Description | Delta v. Model |
|---|---|---|
| CSIRO Graincast | 1.9 2 t/ha | 0.04 t/ha |
| ABARES Crop Forecast | 2 t/ha | 0.06 t/ha |
Future Work
- Source more local and regional time-series data from government and industry groups to test the model hypothesis across multiple regions incorporating soil data, elevation, and other geographic variables.
- Experiment with random forest models to further evaluate the impact each month throughout the year has on the final harvest yield.
- Explore more spectral band combinations using eemont that can be used as input variables.