Drought, dieback, and wildfire in southern California
Mentors: Natasha Stavros and Joseph McGlinchy
Course: Earth Analytics Applications, CU Boulder, Summer 2021
Fire, fire everywhere and hardly a drop of water
Since I decided to work on a project about wildfire in the western United States last April, I've noticed that headlines about drought and wildfire are everywhere. Here are a few from NPR from just the past few months:
- Abnormally Dry California Forests Are A Grim Warning For 2021's Wildfire Season
- Deepening Drought Holds 'Ominous' Signs For Wildfire Threat In The West
- Warming Climate Amplifies The Risks Of Wildfire Season
- New Wildfires Are At A 10-Year High In The Hot, Dry Western U.S.
Barrels of ink have been spilled on what the ongoing drought in the west means for fire season there, and it's hardly even summer yet. But you can't really blame people for being concerned.
A very bad day
The linked perils of drought and fire were made plain on November 8, 2018, which saw three large fires ignite in California on the same day: the Camp Fire in northern California, which would become the deadliest fire in California history, and the Woolsey and Hill Fires in southern California, which occurred within miles of each other and strained local firefighting resources to the breaking point. Firefighters managed to contain the Hill Fire with limited damage, but the Woolsey Fire, driven by the Santa Ana winds, went on to burn nearly 100,000 acres of chaparral, sage, and oak in the Santa Monica Mountains north of Malibu before it was contained on November 22nd. Three people were killed in the fire, and over 1,600 structures were destroyed.
The November 8th fires followed four years of extreme drought that caused widespread dieback of grass, shrubs, and trees throughout California. Understanding these fires may provide insight into what we can expect from fire season in a bone-dry west.
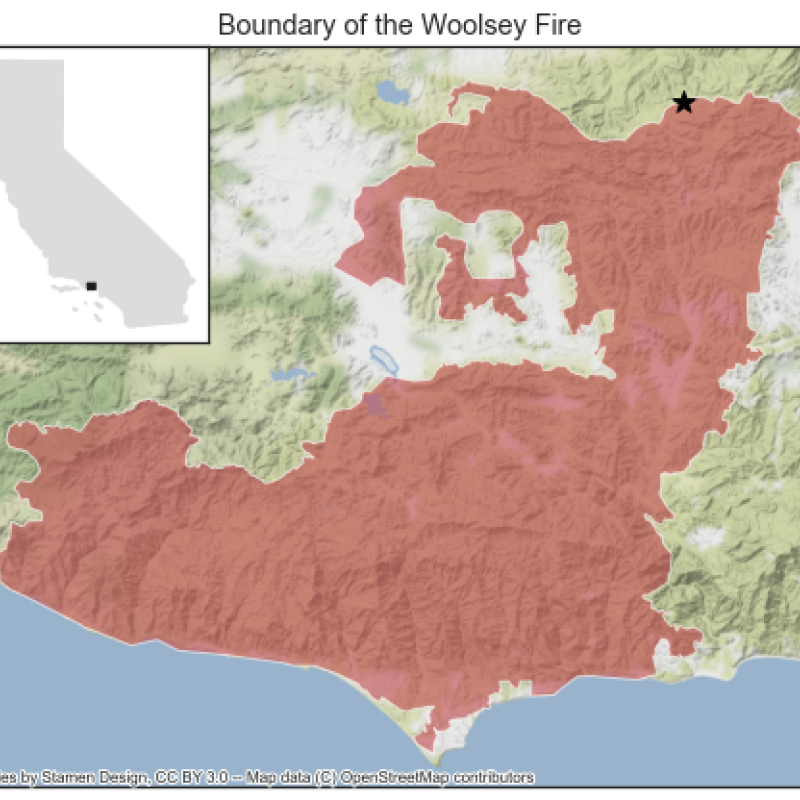
Fig. 1. Woolsey Fire scar with an inset showing the location of the study area in California. The black star in the northernmost part of the scar shows roughly where the fire started.
Modeling the Woolsey Fire
With the help of Natasha Stavros and Joe McGlinchy of CU Boulder, I've been building a model that looks at how drought contributed to the severity of the Woolsey Fire. This project was inspired by the following image:
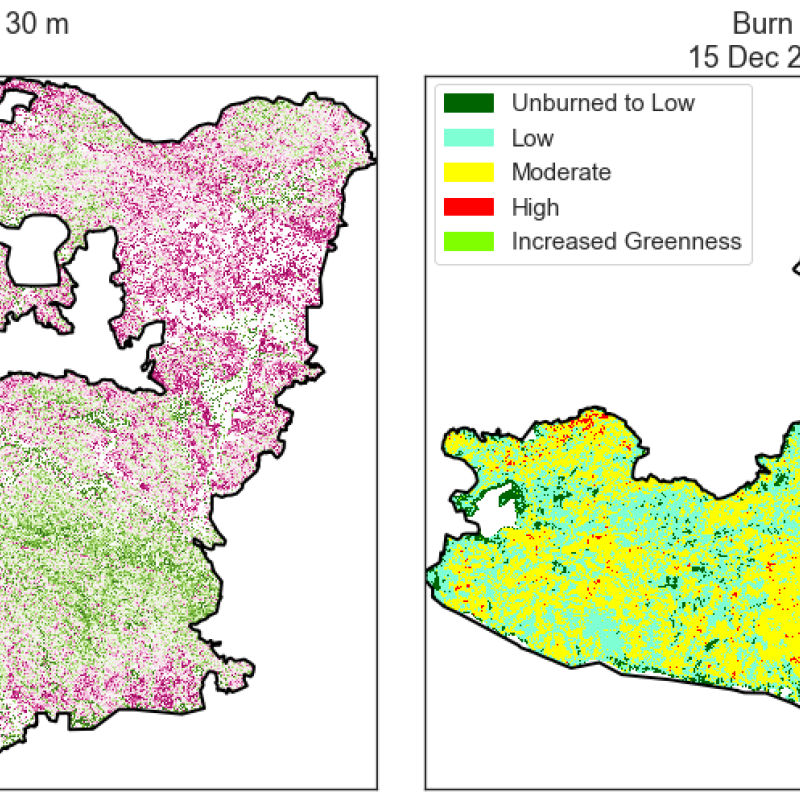
Fig. 2. Fraction-alive (left) and classified burn-severity (right) plots for the Woolsey Fire. The FAL data shown here was calculated for a study of the effect of drought on the Santa Monica Mountains (Dagit et al., 2017 and Foster et al., 2017). The burn-severity data used here and below was created using data from Monitoring Trends in Burn Severity (MTBS), a federal program that creates field-validated burn-severity maps for major wildfires in the United States (Eidenshink et al., 2007).
The map on the left shows the health of the vegetation in 2016 using a metric called fraction alive (FAL), which is the ratio of green to total (green plus brown) vegetation. The map on the right shows the severity of the Woolsey Fire, with the areas where the fire was worst in yellow and red. Most yellow pixels are in the chaparral-dominated southern half of the fire scar, while most red pixels occur in and around rare oak woodlands.
The observation that sparked this project is this: Areas of healthy vegetation in the left image appear to correspond to the highest-severity burns in the right image. That is, the greener vegetation suffered more in the Woolsey Fire. Does that apparent relationship withstand further scrutiny? Can FAL be used to help predict where a wildfire will cause the most damage? If so, it could be a useful metric to consider when planning for fire season.
To answer these questions, I combined the FAL data with other information about the region from the years before the Woolsey Fire, including topography, climate, and vegetation. I then used an algorithm called random forest to try to figure out how each bit of data contributed to the pattern of burn severity. I evaluated the model using two metrics:
-
Precision, which is the percentage of pixels predicted by the model that are assigned to the correct class. High precision means that pixels are usually what the model says they are.
-
Recall, which is the percentage of pixels that belong to a given class that are identified by the model. High recall means that a model is catching most pixels in a given class.
Early versions of the model had promising precision and recall scores (70-75% for both metrics), but they also had a major problem:
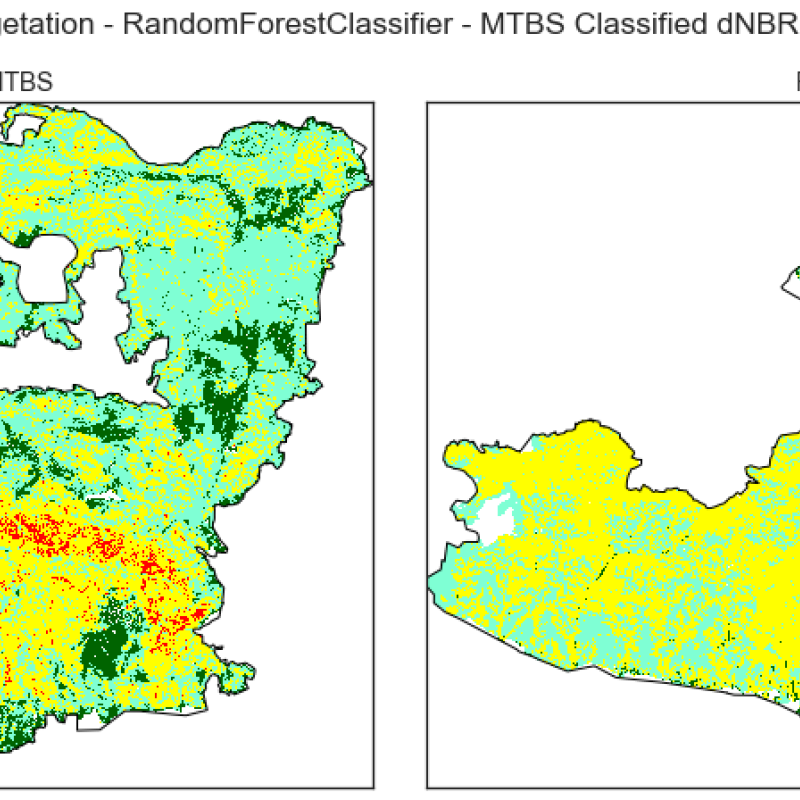
Fig. 3. Observed (left) and predicted (right) burn-severity plots for the Woolsey Fire. This model has high overall accuracy (70-75%) but fails to pick out areas with high-burn severity.
They didn't pick out a single high-severity pixel!
Tipping the balance
The problem is that there are very few high-severity pixels in the burn-severity plot, so the model didn't pay much attention to them. Getting a few pixels wrong didn't have much effect on the overall accuracy, and getting them right was difficult because there are relatively few of them to analyze.
But high-severity burns are important in understanding the harm a fire causes to an ecosystem. They cause the most long-lasting damage to vegetation and soil. I wanted to be able to predict where kind of damage was likely, so I looked into how I could tweak the model to better identify those pixels. Imbalanced data like this turns out to be a common problem in data science, and I was able to update my model to get at those high-severity pixels. Sure enough, the updated model correctly identifies around 80% of the high-severity pixels. But that high recall comes at a cost:
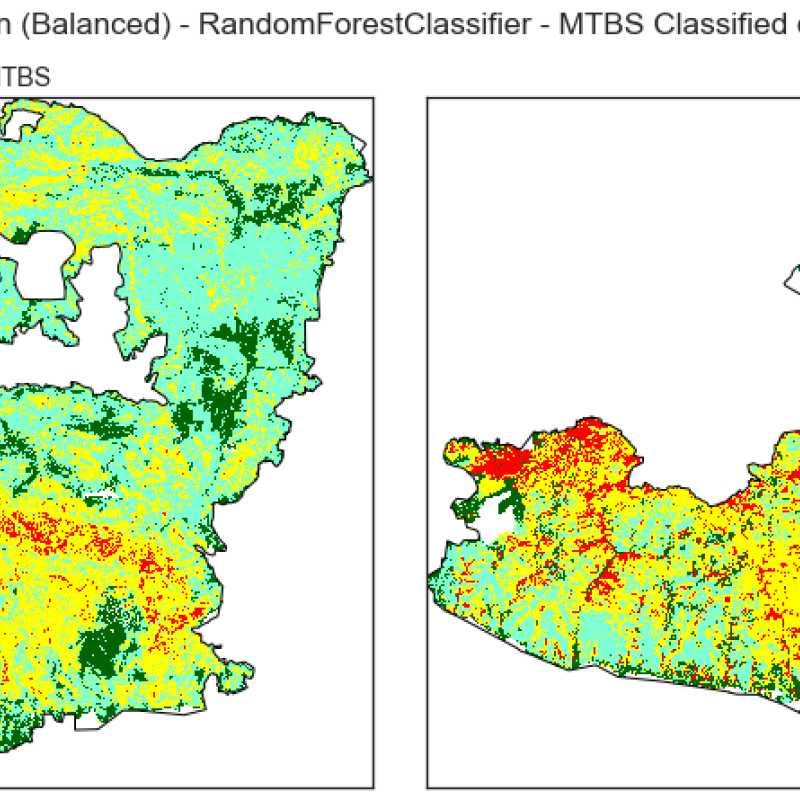
Fig. 4. Observed (left) and predicted (right) burn-severity plots for the Woolsey Fire. This model has lower overall accuracy (55-60%) than the model in Fig. 3 and is super aggressive about predicting high-severity pixels. Still, it does find most of them.
The rough pattern of high-severity pixels is preserved, yes, but the model predicts way more red pixels than are found on the original map. In fact, only one red pixel in ten predicted by the model actually corresponds to a red pixel in the original data. This, then, is a high-recall, low-precision model.
This tradeoff between precision and recall is a common problem with imbalanced datasets, and I was not able to improve the precision of the model beyond what I've shown here. The upshot is that:
- The high-accuracy model (Fig. 3) is probably more useful for predicting low- to moderate-burn severities, that is, the general pattern of burn severity
- The high-recall, low-precision model (Fig. 4) is probably more useful for identifying general areas that are susceptible to high-severity burns
The lack of precision may, in part, result from using only on pre-fire data. Wind, weather, and firefighting response can all alter the course of a fire, and it's easy to imagine that an area that burned moderately on the day of the Woolsey Fire could have burned worse under different conditions. Since modeling is basically a numbers game, the approach I used might also fare better with a fire that produced larger areas of high-severity burns.
What about FAL?
I wanted to close with a word about FAL, since that was the metric that inspired this project. FAL itself didn't make it into the models I showed above. It works reasonably well for predicting the pattern of burn severity seen in the Woolsey Fire, but satellite measurements of vegetation water content fill a similar need and proved more useful in the end. Those moisture metrics were important across all the models I tried, with high moisture contents generally predicting worse burns. This is a well-established relationship in fire ecology (albeit one I was unfamiliar with). As drought continues to grip the west, it's worth remembering that the end of that drought, whenver it comes, will not mark the end to the risk of wildfire there.
Acknowledgments
I would like to acknowledge Michael Sutherland for his contributions to this project as part of the Earth Analytics course in Spring 2021.
References
- Dagit R, Contreras S, Daukiss R, Spyrka A, Quelly N, Foster K, Nickmeyer A, Rousseau B, Chang E. How can we save our native trees? Drought and Invasive Beetle impacts on Wildland Trees and Shrublands in the Santa Monica Mountains. Final Report for Los Angeles County Contract CP-03-44. 2017. Avalable from: https://www.rcdsmm.org/wp-content/uploads/2016/04/Drought-and-Invasive-Beetle-impacts-RCDSMM-1.2.18.pdf.
- Eidenshink J, Schwind B, Brewer K et al. A Project for Monitoring Trends in Burn Severity. Fire Ecol. 2007;3:3-21. doi:10.4996/fireecology.0301003.
- Foster K, Queally N, Nickmeyer A, Rousseau N. Appendix: Santa Monica Mountains Ecological Forecasting II: Utilizing NASA Earth Observations to Determine Drought Dieback and Insect-related Damage in the Santa Monica Mountains, California. 2017. Avalable from: https://www.rcdsmm.org/wp-content/uploads/2016/04/Drought-and-Tree-Appendices_12.15.17.pdf.