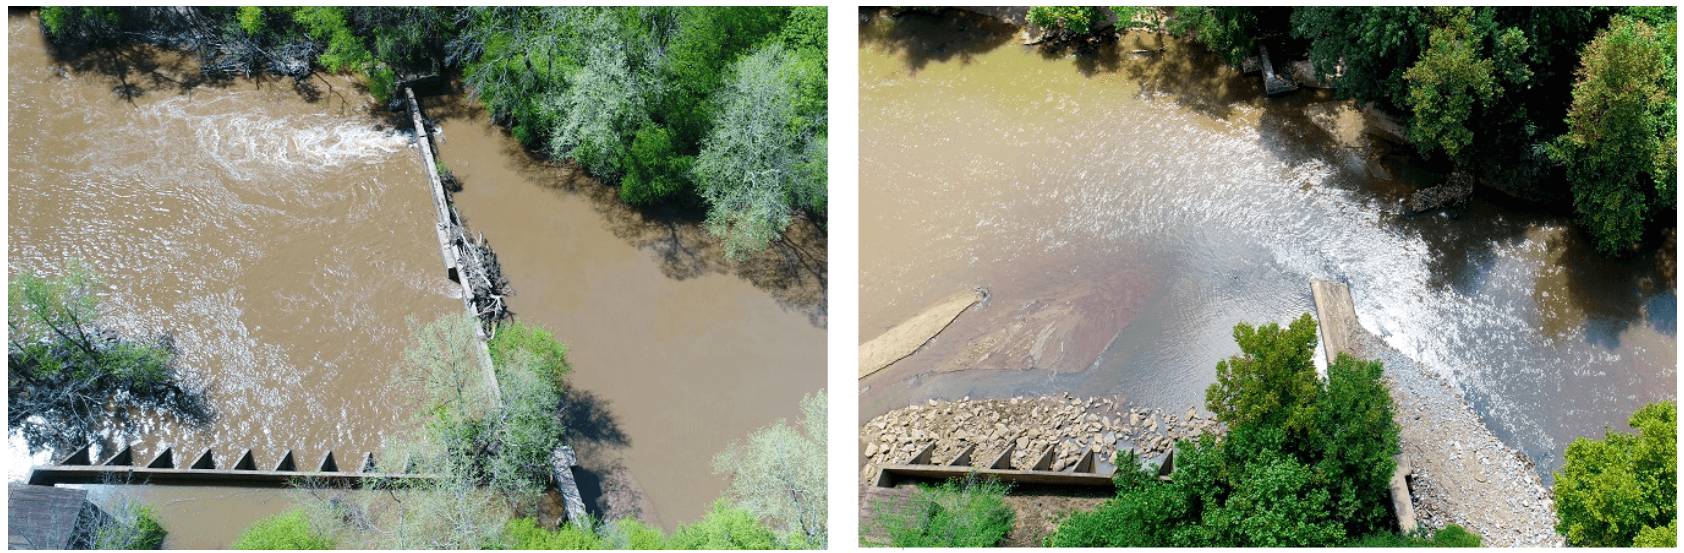
Dam: You're Really Disrupting the Flow
In partnership with Jeff Opperman and Natalie Sharbol WWF
Introduction
Only one-third of the world’s large rivers still have their free-flowing status, meaning river segments are connected from a river’s headwater to the final downstream outlet. Dams are the main cause of river fragmentation and loss in connectivity. However, not all dams are built the same, nor serve the same purpose, and thus may have different effects on river connectivity. Dams are constructed for drinking water reservoirs, water for irrigation, flood control, hydroelectricity, and recreation, to name a few. We have used dams to control rivers for our needs and this fragmentation has had a negative impact on biodiversity and the overall health of riparian systems. The disruption in movement and exchange of water, nutrients, organisms and sediment has impacted ecosystem processes.
For this project, we performed global analyses examining relationships between dam types and river connectivity characteristics. In particular, we examined how these relationships varied across six continents. These findings will support conservation efforts by identifying which dam types have greater impacts on river connectivity. This information can be used to create sound arguments against the construction of new dams and help with proposals to remove and manage existing dams.
Methods
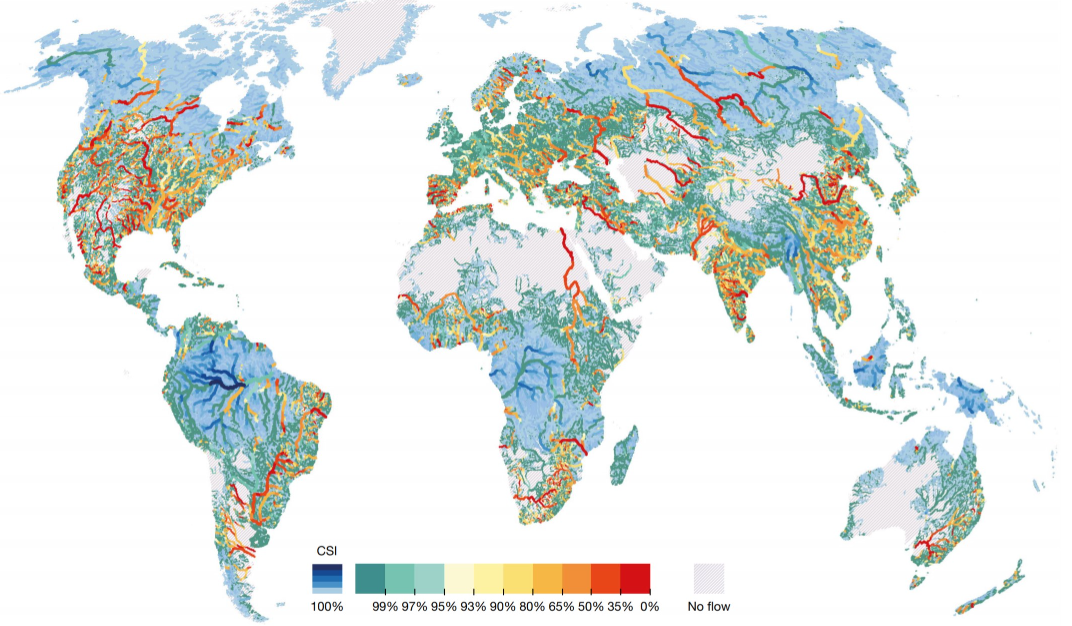
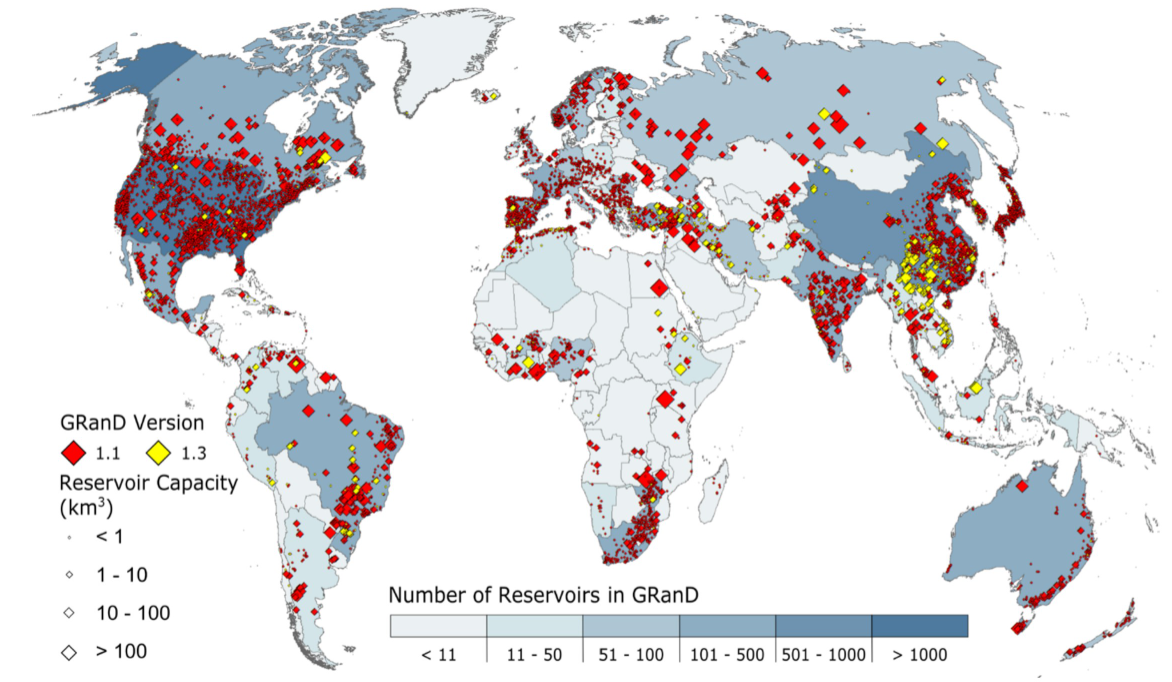
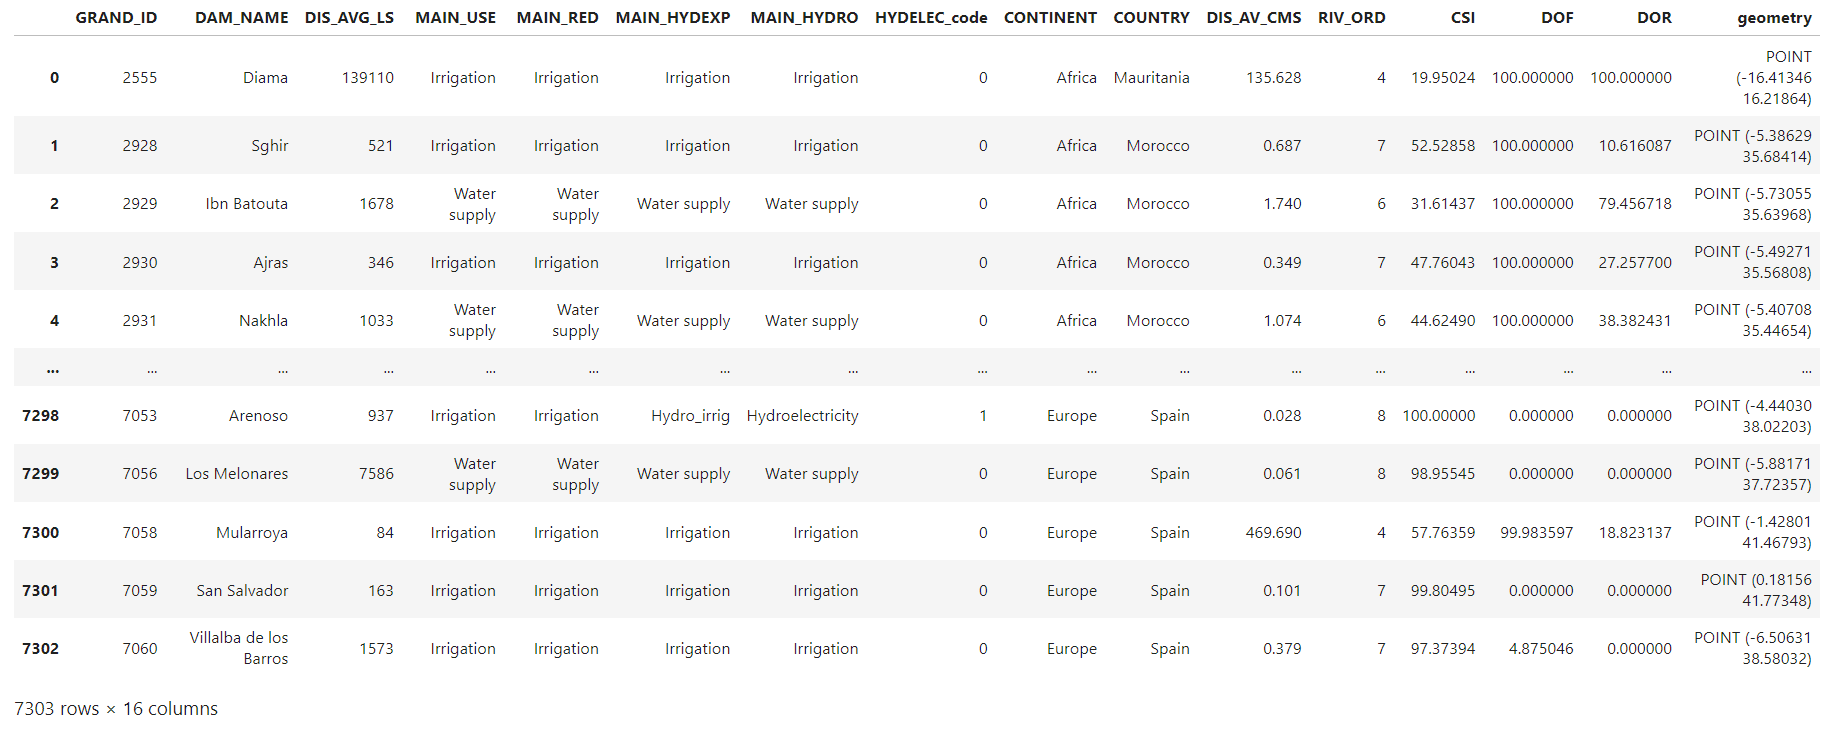
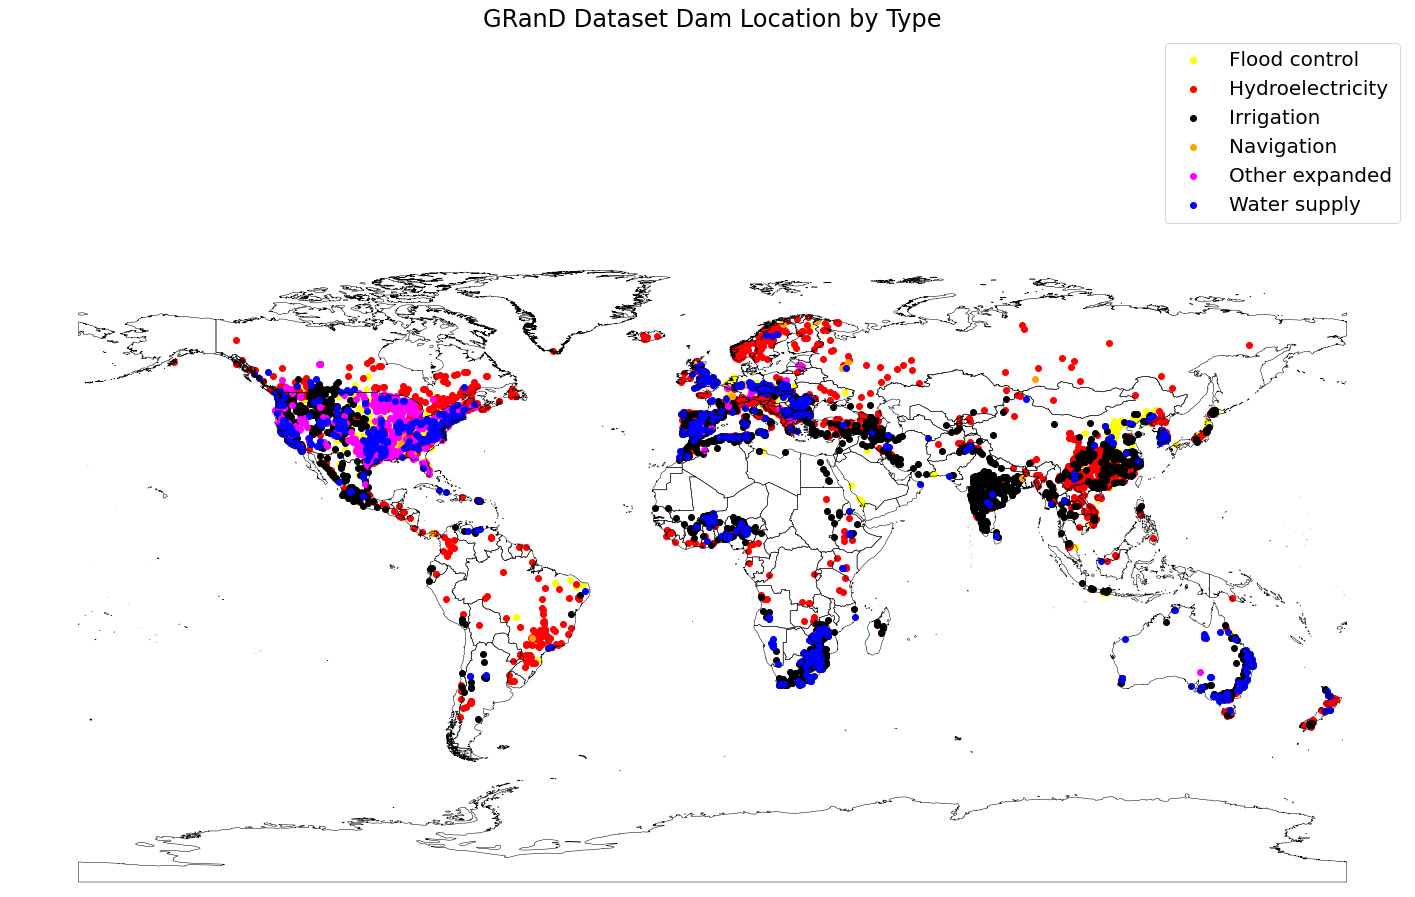
We combined two related, pre-existing databases: 1. The Free-Flowing Rivers (FFR), a global river dataset with information on how fragmented the river flow is, and 2. the Global Reservoirs and Dams database (GRanD), a global dam dataset with information on dam types and locations. Using these two datasets we were able to tease out information on the relationships between dam type and river flow disruption. During processing we grouped minor dam types so we could look more closely at trends involving the most common dam types, such as irrigation and hydroelectricity.
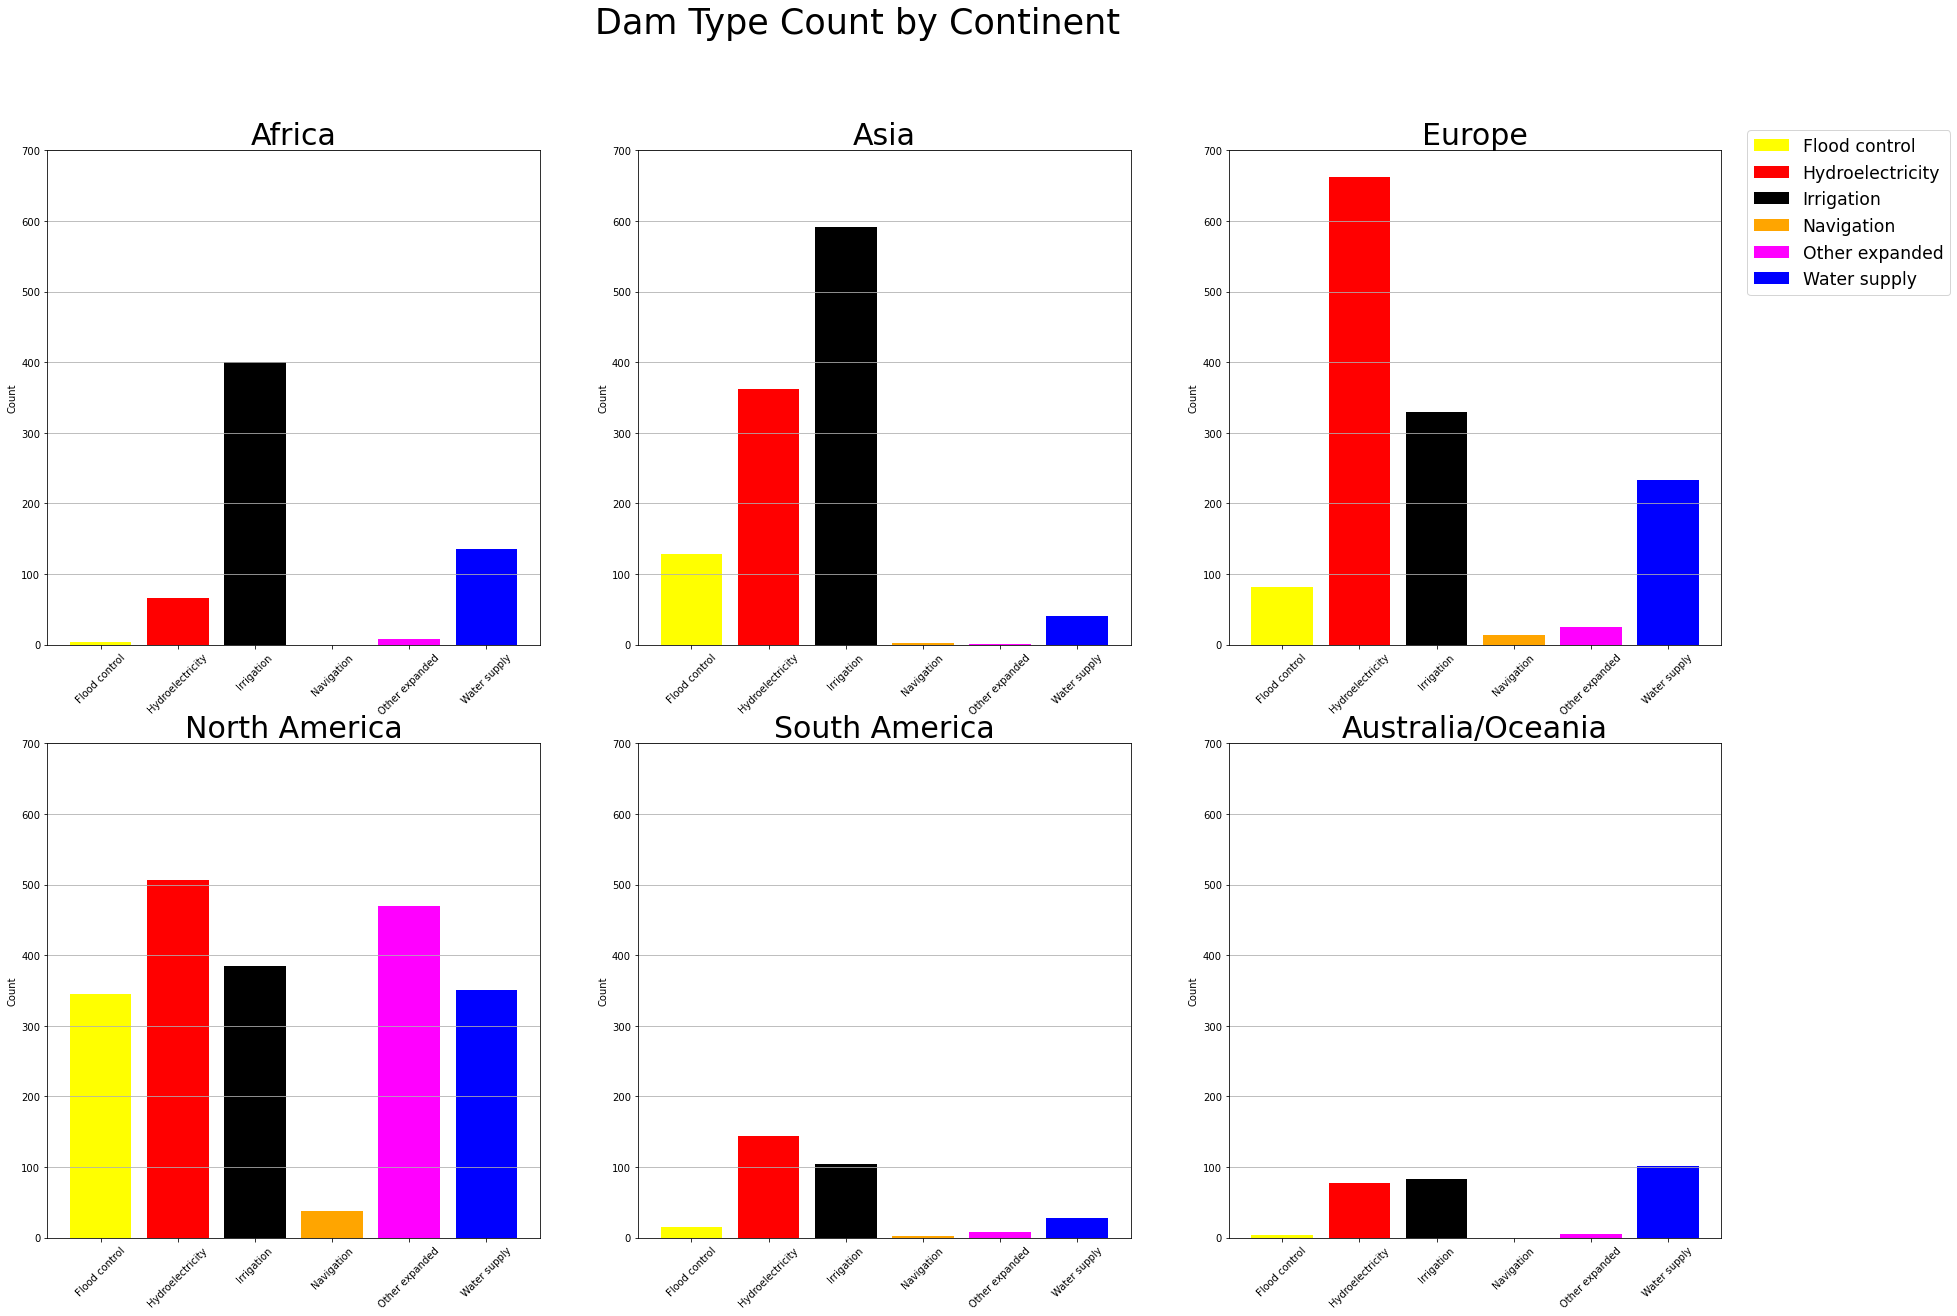
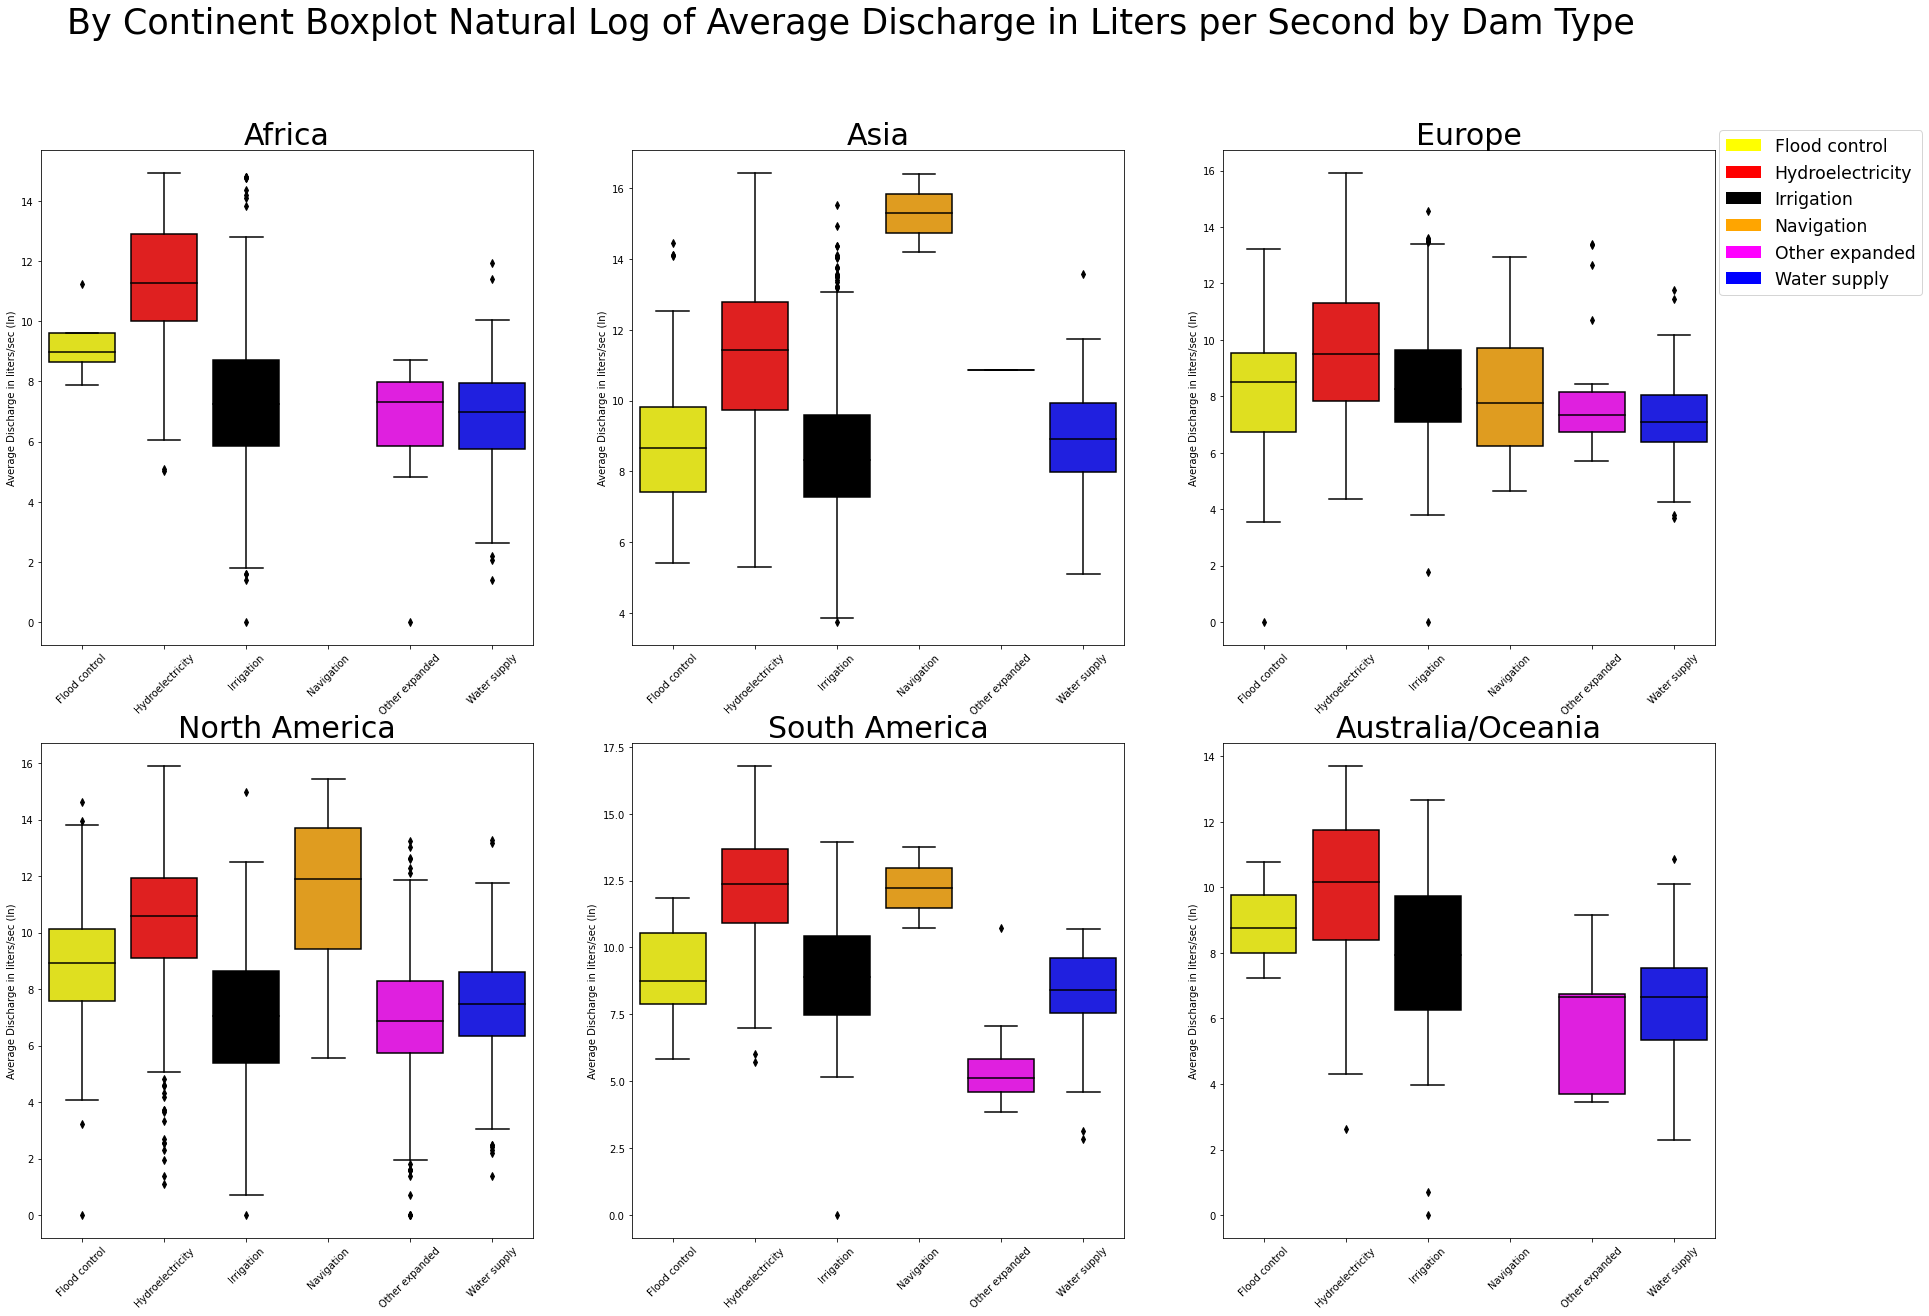
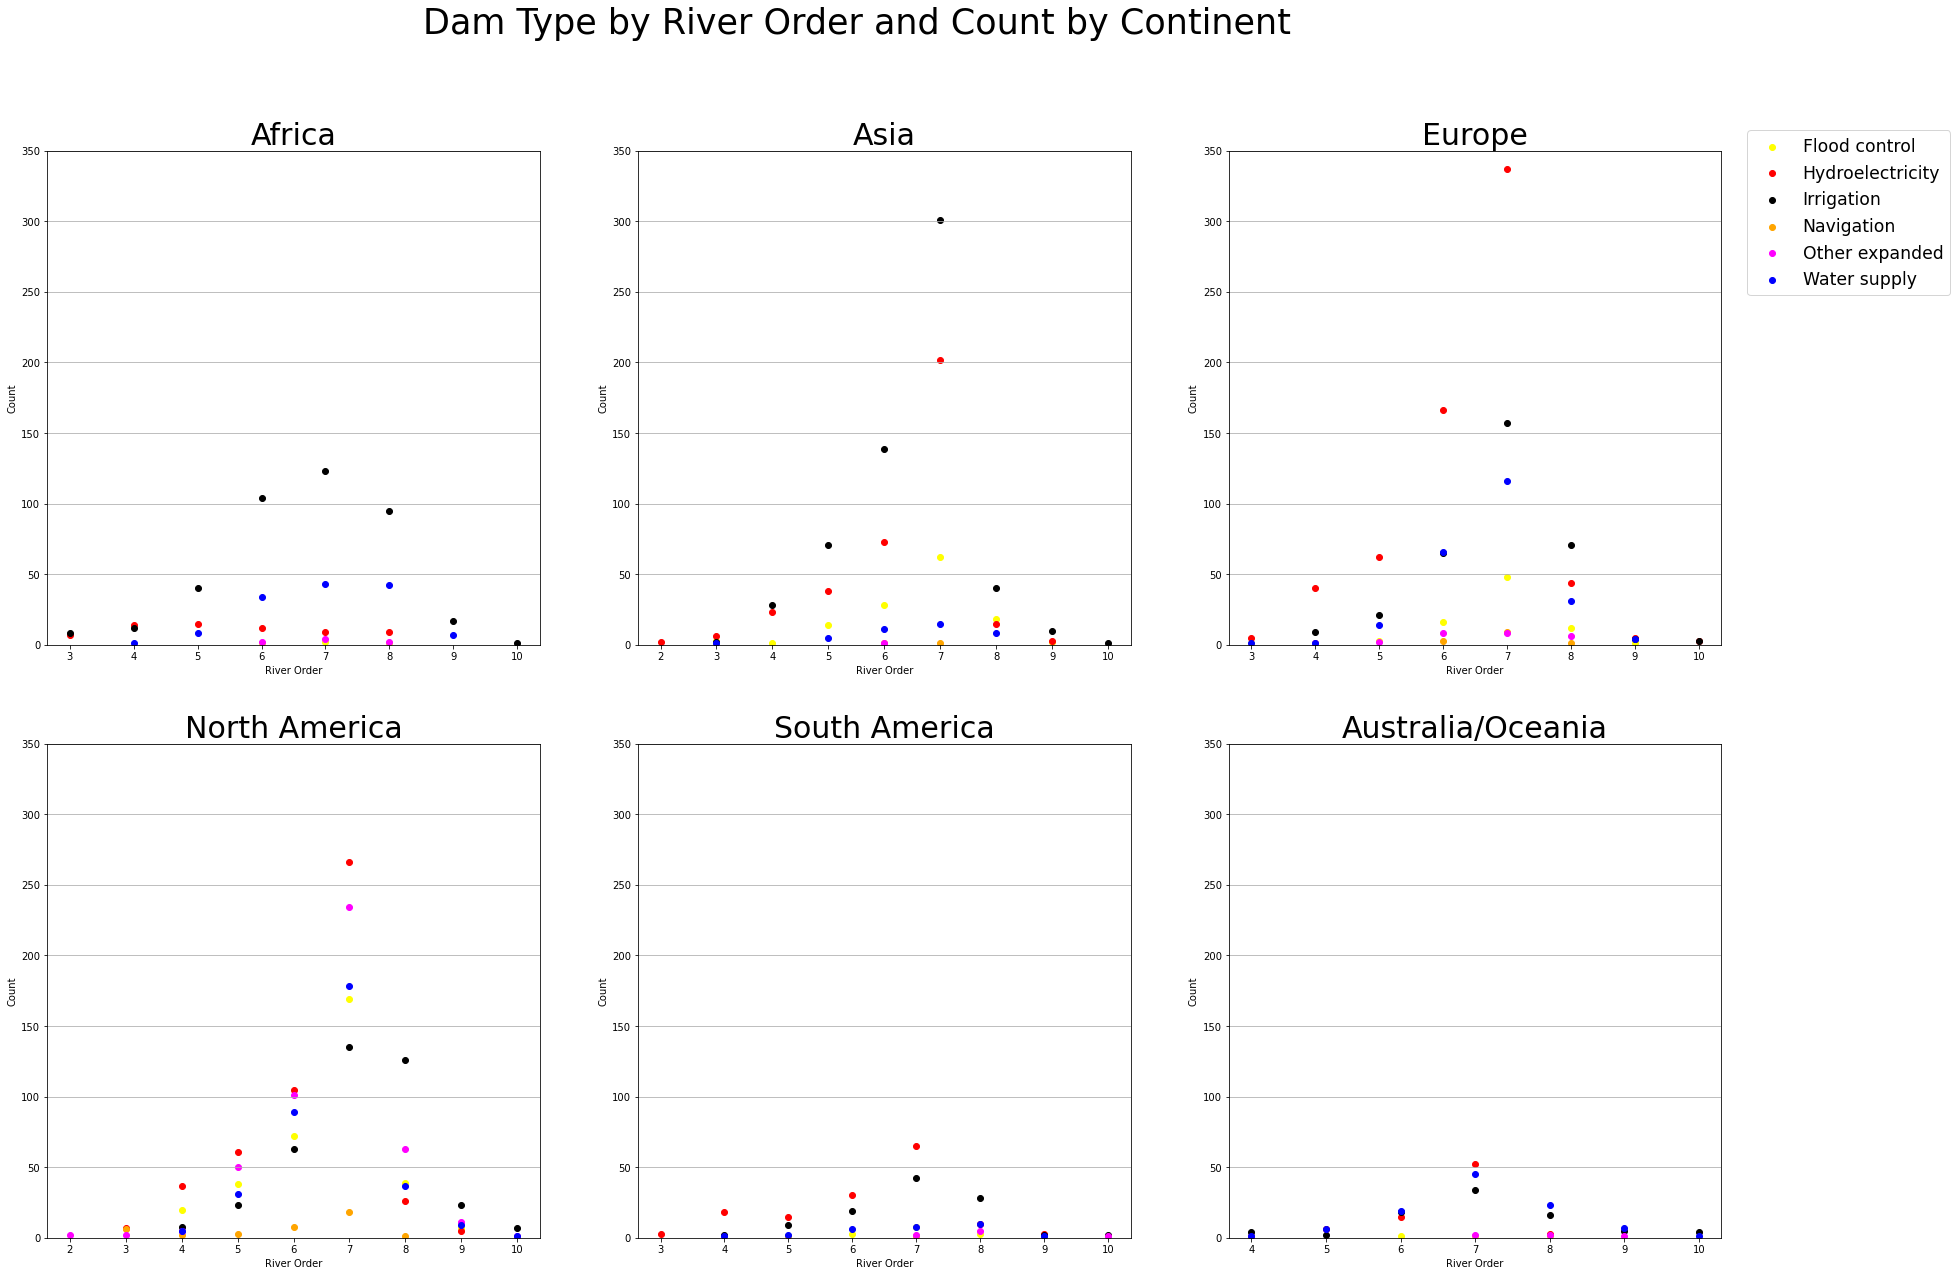
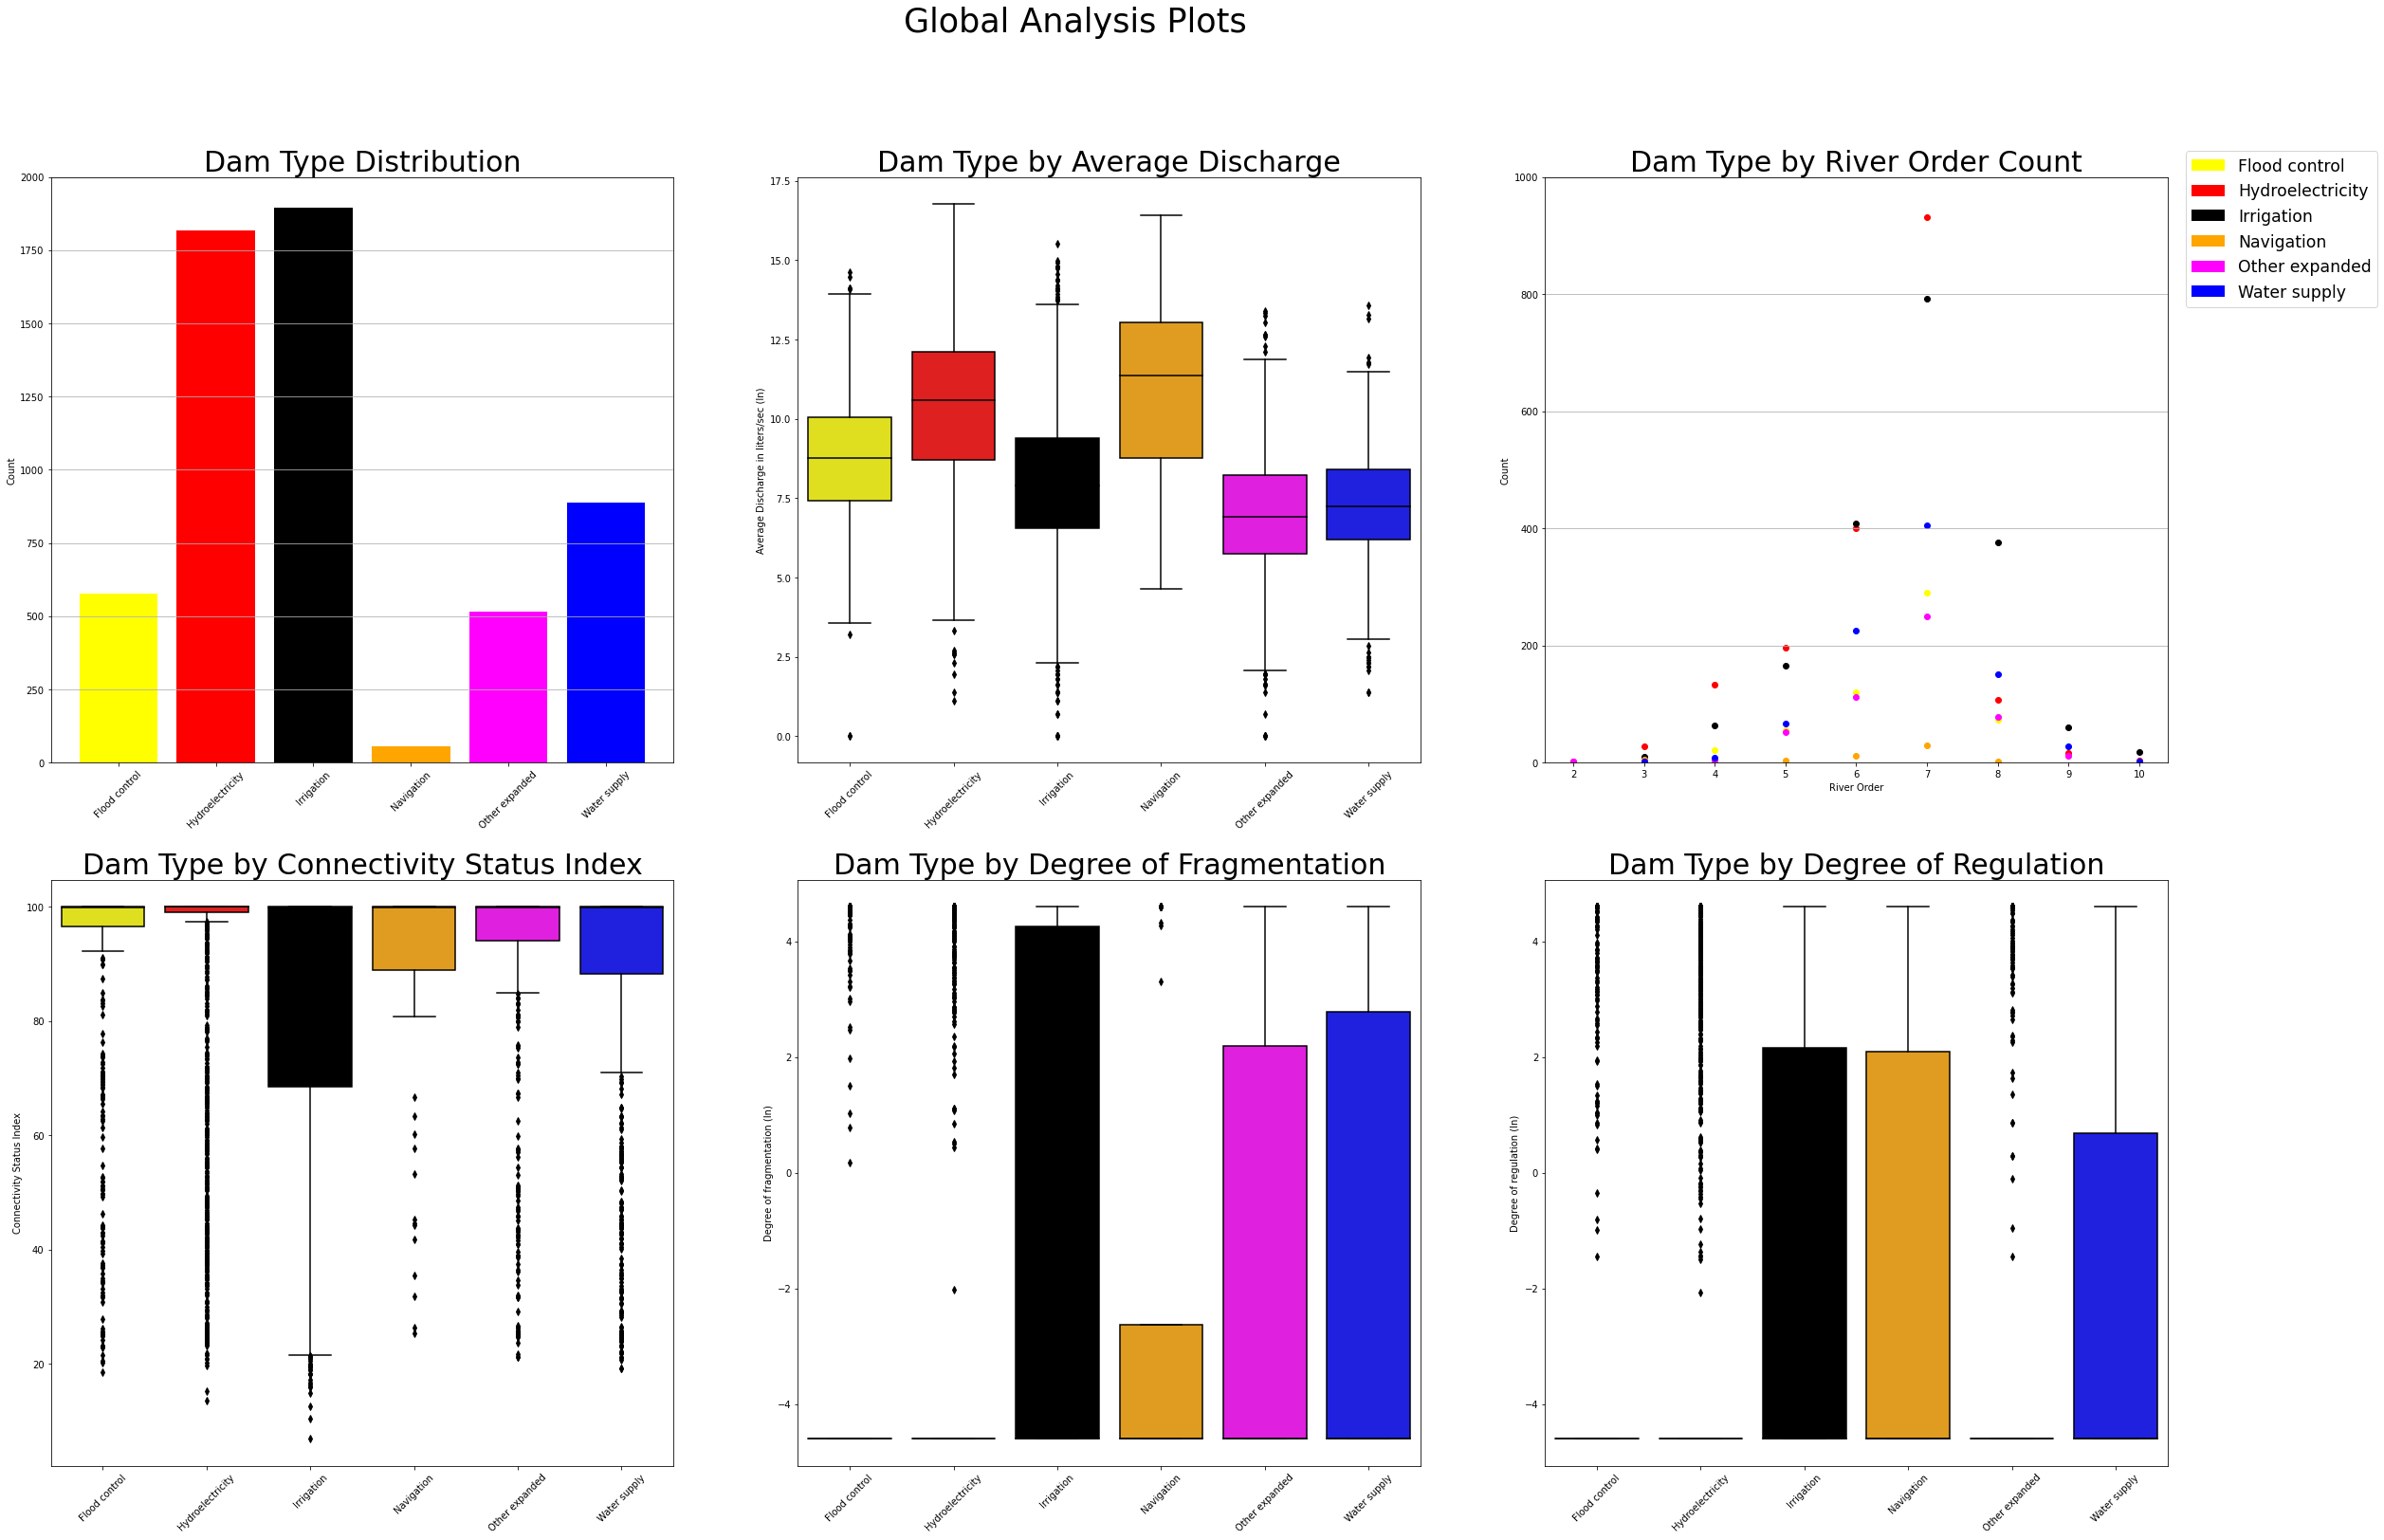
For each variable, we analyzed trends on a continental and global scale. First, we sought distribution counts of each dam type via bar plot, which gives us a sense as to which types are constructed most. Second, we analyzed cumulative river flow intercepted by each dam type via box and whisker plots and scatter plots; generally, the larger the amount of river flow intercepted (or larger river order) by a dam type, the higher the disruption that dam type is causing. We also used box and whisker plots to look at the dam type variance in overall river connectivity (CSI), downstream (longitudinal) river flow disruption (DOF), and river to bank and floodplain (lateral) connectivity (DOR).
If you are curious to see the technical processing and code behind the analysis, please check out our GitHub Repository .
Findings
From continent to continent, we see differences in the abundances of dams that are built to serve different purposes. Hydroelectric dams are one of the most prevalent dam types, especially in developed continents of Europe and North America. In contrast, the most prevalent dams in Africa and Asia are built for irrigation purposes. Globally, these two dam types make up the greatest number of dams constructed globally, and both intercept some of the greatest volumes of river flow compared to other dam types.
We found associations among dam type and the amount of river flow (or discharge) that the dams intercept along a river network; Hydropower dams tend to be present on larger rivers than Irrigation dams. Among CSI variables, we notice that Irrigation has a bigger effect on DOF and on DOR than Hydropower. So on a global scale, hydropower may affect more river flow on the whole, while irrigation may have a higher impact on a river by river basis. Findings vary and become more nuanced on continental-scale analyses.
Final Discussion
Dams are being built globally to meet various human needs but threaten to disrupt river flow dynamics and impact important ecological processes like fish migration. To address these concerns, we compiled global dam and river connectivity datasets to examine patterns between dam type and river characteristics related to river size and connectivity status. We found distinct patterns in the types of dams and their distributions by continent and river size through our maps and figures. In general, hydroelectric and irrigation dams were the most abundant dam types at a global extent. However, these different dam types had different effects on river connectivity. While hydroelectric dams did not have strong patterns with river connectivity measures, dams built for irrigation or water supply were associated with greater river connectivity loss.
However, there is a great deal of variation in connectivity measures across dam types and future work will need to examine what factors may be driving these variations such as river size and geographic location. Future efforts may take a closer look at regional scale variance, utilize case studies, look at other CSI metrics, and try recalculating CSI values with dam impacts subtracted. Teasing apart these differences in dam type impacts on river connectivity can support river conservation efforts. We acknowledge Jeff Opperman and Natalie Sharbol from WWF for their guidance and data support.
Literature cited
Grill, G., B. Lehner, M. Thieme, and others. 2019. Mapping the world’s free-flowing rivers. Nature 569: 215–221. doi:10.1038/s41586-019-1111-9
Lehner, B., C. R. Liermann, C. Revenga, and others. 2011. High-resolution mapping of the world’s reservoirs and dams for sustainable river-flow management. Frontiers in Ecology and the Environment 9: 494–502. doi:10.1890/100125