Soil Moisture and Rainfall During Landslides
Exploring patterns between soil moisture and rainfall during landslide events in the western US using satellite observations
By Jacquelyn Witte
Predicting landslides is important!
Landslides are a serious geologic hazard common to many areas in the US and Canada. There are negative economic, transportation, and habitat impacts resulting from landslides.
There are climate change implications where drought or heavier rains affect the number and severity of landslides.
Objective
The goal of this project is to examine the relationship between soil moisture and precipitation during rainfall-triggered landslide events.
- What does that relationship look like?
- What information can we learn from relating soil moisture to precipitation during a rainfall-triggered landslide?
Primary Study Region: Colorado, USA
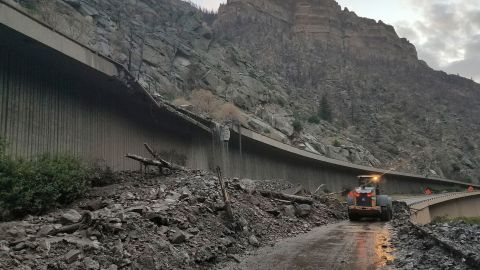
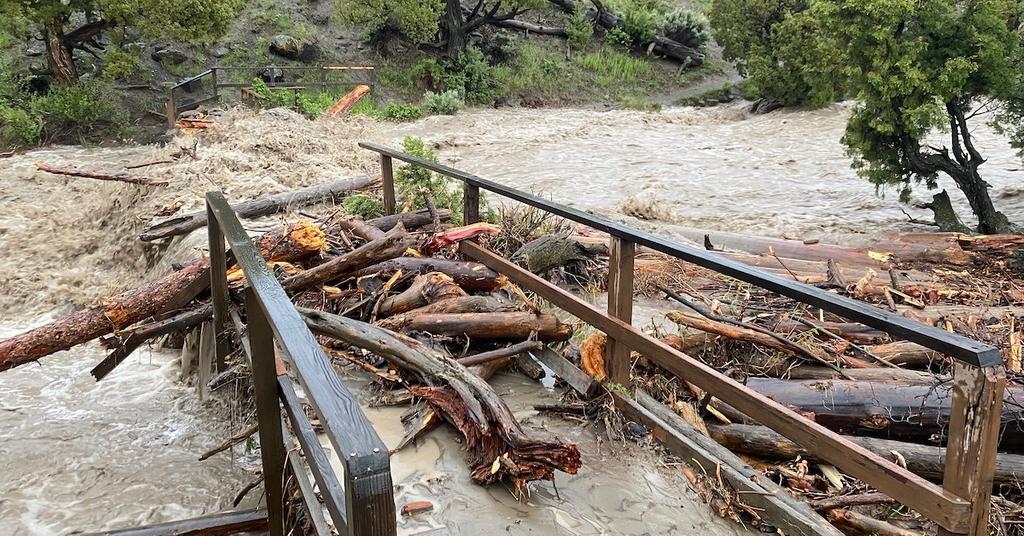
Colorado experiences many landslides each year because of its steep terrain. Some of them occur in remote areas that are difficult to monitor, with most occurring west of the Front Range. Damage from landslides in Colorado is estimated to be millions of dollars per year.
Towns and cities in Colorado's mountainous or hilly terrain are growing and spreading as populations move into these popular destination areas. It is important to understand the potential exposure to landslide hazards, and how counties can maintain optimal land-use and infrastructure to reduce the costs of living with landslides.
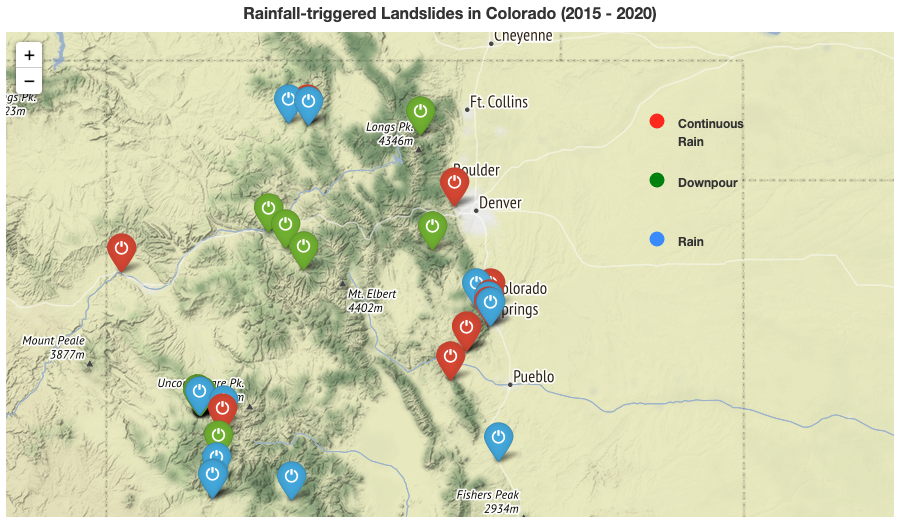
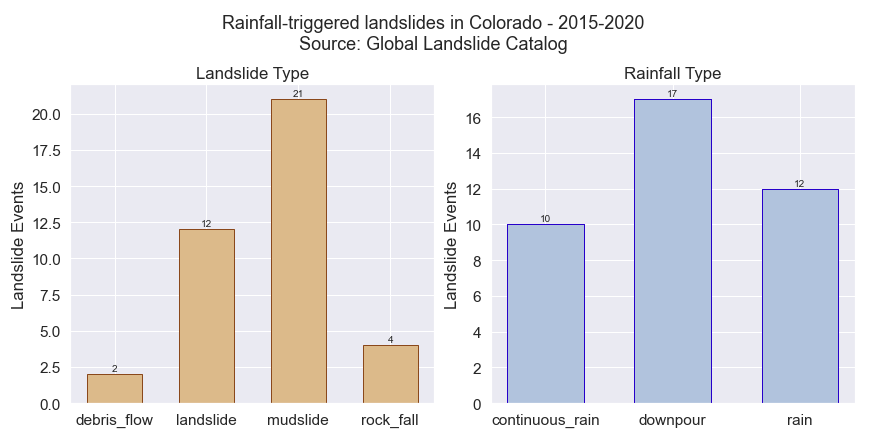
What types of landslides and precipitation are occurring during these events?
The histograms below rely on the NASA Global Landslide Catalog that documents rainfall-triggered landslides around the world. The GLC considers all types of mass movements triggered by rainfall, which have been reported in the media, disaster databases, scientific reports, or other sources. The GLC has been compiled since 2007 at NASA Goddard Space Flight Center.
Note that unfortunately landslide events are not as well cataloged after 2018. However, the GLC remains the best source of landslide information today.
Main Finding
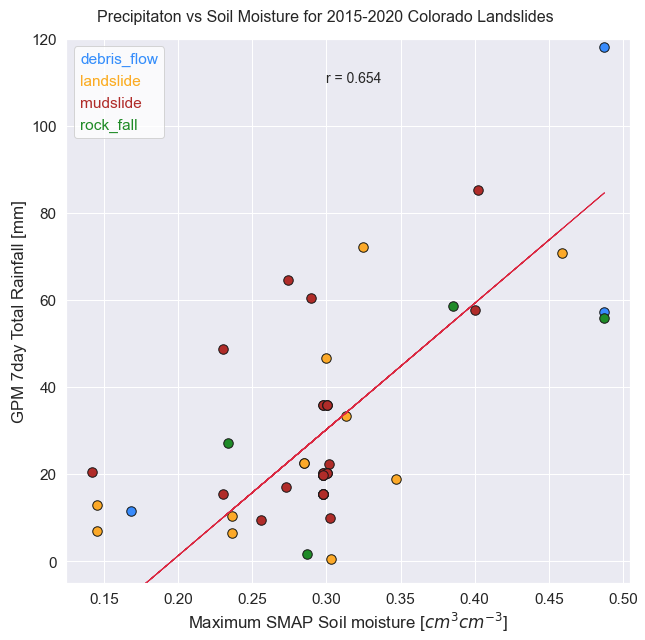
There is a linear relationship between soil moisture and precipitation for Colorado
- The scatter plot below is the sum of all the rain for a week prior to a landslide event versus the maximum soil moisture for that past week.
- The linear relationship means that as precipitation increases, so does soil moisture.
- However, the type of landslide seems randomly distributed indicating limitations in identifying different hydrologic signatures that can cause landslides.
- In the future, we can use this linear relationship to help models improve their accuracy in predicting future landslides over Colorado.
Challenges
There are limitations in using the GLC.
- Complications arise because we rely on accurate landslide locations and definitions of the type of landslide (just calling it a landslide ignores a myriad of types) and the rainfall type that triggers a landslide. These are not always accurately defined.
- Not all landslides are documented so we can think of the Global Landslide Catalog as representing a fraction of all landslide events.
- The landslide categories of debrisflow
and μdsl
is a misnomer. Debris flows are also known as mudslides.
The resolution and data gaps in the satellite retrievals are another limitation.
- The SMAP soil moisture contain gaps and only started measuring in 2015.
- The daily GPM rainfall data contains very few measurement gaps but the time resolution is course. Conversely, the 30-minute data has higher accuracy of rainfall depth during a landslide event, but there are numerous data gaps. The balance was to merge both measurements in the scatter plot below.
Data Sources
- These observations come from NASA's Global Precipitation Measurement (GPM) and the Soil Moisture Active Passive (SMAP) satellites.
- The nearest-neighbor method is used to extract GPM measurements closest to the landslide location.
- SMAP measurements represent the maximum value within 0.3 degrees around the Landslide event.
The scatter plot above shows there are a significant number of landslides for which there is both low rainfall and low soil moisture. Let's explore this some more.
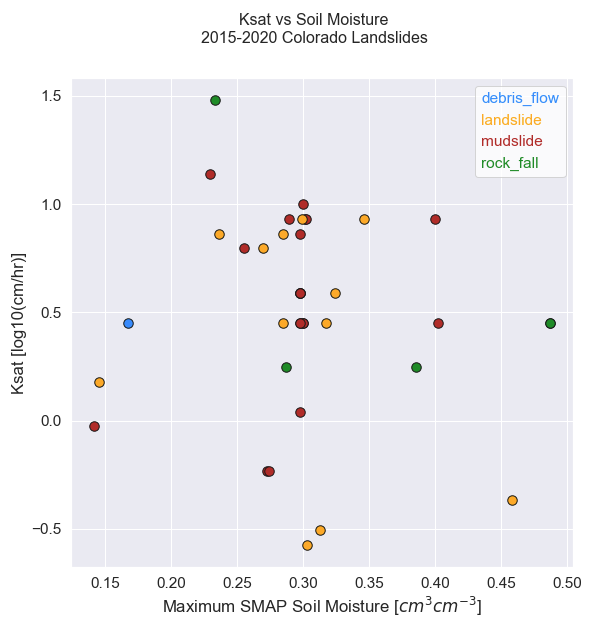
Below is a scatter plot of the Ksat (Saturated Hydraulic Conductivity) vs soil moisture.
- Ksat is a measure of how easily water can pass through soil or rock. The units represent the infiltration rate once the ground has reached 100% saturation.
The scatter plot below shows that most of the ksat values are positive indicating saturated flow is occurring. In most soils this situation takes place when about 95% of the total pore space is filled with water.
The soil type over most landslides is sand or gravel based (mean is 43%±
17%), followed by silt (mean is 36%±
10%), and clay (mean is 20%±
8%).
- Sand is the largest mineral particle and it has more pore space between its particles than silt or clay. Silt particles are smaller than sand, but larger than clay particles.
- Soils with this percentage combination can have moderately high runoff potential when thoroughly wet.
Data Sources
- Ksat and soil type data come from the Probabilistic Remapping of SSURGO (POLARIS) soil properties — a database of 30-m probabilistic soil property maps over the US.
- We use the mode statistics at 5-15 cm depth
- The nearest-neighbor method is used to extract Ksat measurements closest to the landslide location.
- Interpretation of the Ksat and porosity analysis was found in this study
Git Hub Resources
Additional analyses and information that incorporates other soil moisture and precipitation variables can be found in the The GitHub landslides-soilmoisture repository
Data References
NASA Global Landslide Catalog (2015-2020)
Citation: https://doi.org/10.1007/s11069-009-9401-4
NASA SMAP Enhanced L3 Radiometer Global Daily 9 km EASE-Grid Soil Moisture V004
Citation: https://doi.org/10.5067/NJ34TQ2LFE90.
GPM IMERG Late Precipitation L3 1 day 0.1 degree x 0.1 degree V06
Citation: https://doi.org/10.5067/GPM/IMERGDL/DAY/06
GPM IMERG Final Precipitation L3 Half Hourly 0.1 degree x 0.1 degree V06
Citation: https://doi.org/10.5067/GPM/IMERG/3B-HH/06
This data product uses 30 min GPM IMERG data pre-assembled and saved in CSV format by Dr. Elsa Culler (CU-Boulder). The beauty of this data set is that precipitation values have been subset and co-located with GLC landslides by their ID, latitude, and longitude. Request this data set by emailing Elsa.Culler@colorado.edu
POLARIS 30m Probabilistic Soil Properties US
Citation: https://doi.org/10.1029/2018WR022797