Towards Near-Real-Time Fire Event Perimeter Mapping Using Optical And Radar Data Fusion
Summer Graduate Research Assistant, Behzad Vahedi, discusses Near-Real-Time Fire Event Perimeter Mapping Using Optical And Radar Data Fusion
Towards Near-Real-Time Fire Event Perimeter Mapping Using Optical And Radar Data Fusion
Author: Behzad Vahedi
In collaboration with: Cibele Amaral, Ryan Cassotto, Kristy Tiampo, Natasha Stavros
Introduction
One of the most pressing challenges in managing wildfires is to define their spatial and temporal boundaries accurately and promptly. Understanding where a fire begins, how quickly it spreads, and where it might move next can mean the difference between a successful containment strategy and a catastrophic event. Accurate and up-to-date fire perimeter mapping is not only vital for the safety of communities and firefighters, but it's also essential for post-fire recovery and ecosystem management.
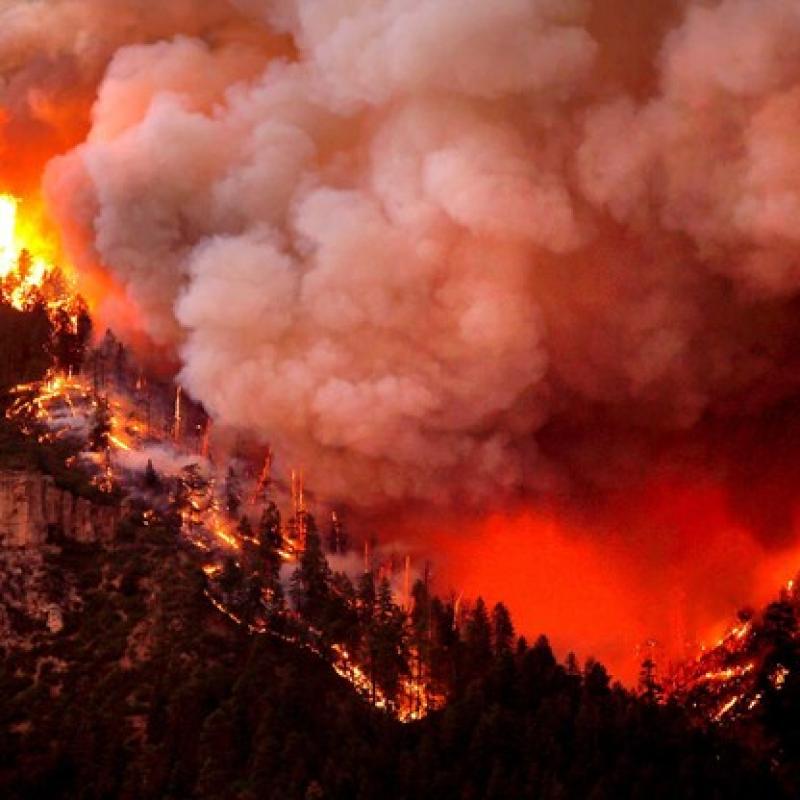
Figure 1. A wildfire in Colorado. Image from the New York Times.
In this era of rapid environmental changes, our traditional methods of mapping and monitoring fires might not always suffice. That's where innovations like remote sensing and sophisticated algorithms come into play. The EarthLab’s "Fire Event Delineation for Python (FIREDpy)" is one such pioneering tool. As an open-source software, FIREDpy automates the download and processing of the MODIS burned area product for a specific area of interest. Using a spatiotemporal flooding algorithm, it transforms countless grids into a comprehensive fire perimeter shapefile. Developed with the ambition to address the lack of accessible fire history data in many regions, FIREDpy is a testament to the potential of combining satellite-based products with advanced computing techniques [1,2].
Since FIREDpy utilizes the MODIS MCD64 burned area product, it cannot provide near-real-time information, a critical limitation in dynamic wildfire scenarios. Recognizing this gap, our project aims to evolve FIREDpy by updating it for near-real-time (NRT) fire event perimeter mapping through the fusion of optical and radar remote sensing data. Our main motivations are twofold: to achieve closer-to-real-time temporal resolution and to improve the spatial resolution of the FIREDpy outputs. Notably, the inclusion of Synthetic Aperture Radar (SAR) data offers a distinct advantage – its resilience against smoke interference. This means that even in dense smoke conditions, our updated FIREDpy would be able to delineate fire perimeters with improved accuracy. Our plan is to use Landsat-8/9 and Sentinel-2 satellites for optical imagery. In tandem, we'll be leveraging Sentinel-1 images for our Synthetic Aperture Radar (SAR) needs.
In this blog post, I will provide a summary of our first steps toward this goal, along with our findings and plans for the future
2. Criteria for Near-Real-Time Fire Mapping: Core Considerations
Achieving a near-real-time fire mapping system, especially one that fuses optical and radar data, necessitates addressing a variety of technical and conceptual questions. These will determine the feasibility, robustness, accuracy, and timeliness of the resulting product. We have identified three primary questions that form the foundation of our approach:
I. What Level of Products to Use?
Remote sensing satellites provide data at various product levels, from raw digital numbers to terrain-corrected reflectances to classified thematic products. Identifying the optimal product level for this project requires an evaluation of trade-offs between processing time and the specificity of information required for accurate fire detection and delineation. After careful assessment, we've determined that Landsat Level-1 products and Sentinel-2 Level-2A products are best suited for our methodology.
II. How to Delineate the Fire Perimeter?
The task of extracting meaningful fire perimeters from the processed data requires sophisticated algorithms. These algorithms should consider the unique spectral signatures of active fires, burned areas, and unaffected regions. The challenge lies in developing or adapting algorithms that are sensitive and accurate, while minimizing the risk of false detections.
A key tool in this regard is the Normalized Burn Ratio (NBR). Specifically designed to highlight burnt areas in large fire zones, NBR capitalizes on the distinct spectral reflectance properties of vegetation. Healthy vegetation typically exhibits high reflectance in the Near Infra Red (NIR) region and low reflectance in the Short-Wave Infra-Red (SWIR) part of the spectrum. This contrast becomes more pronounced in burned areas, making the NBR a valuable metric in assessing changes.
To quantify the severity of a burn, it's useful to consider the delta NBR (dNBR). This metric is derived by computing the difference between pre-fire and post-fire NBR values. A higher dNBR suggests more significant vegetation change and often correlates with areas that experienced higher burn severity.
However, it's crucial to acknowledge the limitations of using dNBR in isolation. While it provides valuable insights into burn severity, dNBR alone may not capture the complete extent or intricacies of a fire perimeter. Supplementary data sources and algorithms may be necessary to provide a comprehensive and accurate fire boundary delineation.
III. What Pre-processing (Corrections) Steps are Required?
Effective use of satellite imagery often mandates specific pre-processing steps to ensure data accuracy. For Sentinel-2 L2A or Landsat-8,9 L1 products, several corrections are inherently applied. However, our research suggests that when focusing on Burned Area (BA) products, the Bidirectional Reflectance Distribution Function (BRDF) stands out as a frequently adopted correction.
BRDF can be succinctly described as quantifying the reflectance of a target based on both illumination and viewing geometries. This correction is instrumental in achieving consistent reflectance values, regardless of the angle at which sunlight hits the Earth's surface or the angle from which a satellite sensor observes it.
The pertinent question arises: Is BRDF correction indispensable for a Near Real-Time (NRT) fire delineation product? While its benefits are evident, the additional processing time and potential delays introduced by this correction need to be weighed against the need for timely data in emergency response scenarios. Balancing accuracy and timeliness becomes crucial in deciding the extent of pre-processing required for NRT applications. In the next section, we will investigate the effectiveness of BRDF.

Figure 2. BRDF correction. Image from Wikipedia.
3. BRDF Correction in Burned Area Products
BRDF correction plays a varying role depending on the satellite and the methodology used to derive burned area products.
- MODIS-based Burned Area Products: When it comes to products based on MODIS (Moderate Resolution Imaging Spectroradiometer), BRDF correction is a staple. It is consistently deemed crucial and, as a result, is always applied. The high-frequency revisits and varying angles of MODIS sensors make this correction particularly relevant.
- Landsat-8/9-based Burned Area Products: Interestingly, the official burned area products derived from Landsat-8 and Landsat-9 do not incorporate BRDF corrections [3]. This omission could be attributed to the specific sensor characteristics of these satellites or the methodologies adopted for generating these particular products.
- Sentinel-2-based Burned Area Products: Sentinel-2 offers a more varied landscape when it comes to BRDF correction. Its application fluctuates depending on the specific product and its intended use. For instance, certain research has adopted the use of surface nadir BRDF-adjusted reflectance (NBAR) in their burned area delineations. For instance, David Roy, one of the pioneers in BRDF calculations particularly for Landsat and Sentinel-2, has used surface nadir BRDF-adjusted reflectance (NBAR) for deriving burned area products from both Landsat-8 and Sentinel-2 datasets. Roy states that reflectance variations in NIR and SWIR bands caused by directional effects are not insignificant [4].
In summary, BRDF correction is shown to be helpful, but I think the question is if it is worth the time and the effort, especially in an NRT product. To understand the true effect of BRDF in fire delineation using dNBR, I took the empirical route and conducted an experiment, comparing dNBRs derived from Sentinel-2 images with and without BRDF corrections. This experimental approach is set to shed light on the practical implications of BRDF in fire delineation.
To undertake this investigation, I utilized FiredPy to extract fire events across the Americas spanning from 2019 to 2021. Subsequently, I refined these events based on several criteria: duration (selecting fires that lasted over 20 days), area, land cover, and climate classification according to the Köppen climate classification. From this filtered list, I selected three distinct fire events, each set within a unique climate zone, as the focus of the experiment. These fires were:
- Chuckegg Creek Wildfire in Alberta, Canada, situated in a Continental (Dfc) climate zone. This fire raged for 85 days, from May 13, 2019, to August 5, 2019, burning an area of 2,660 km2.
- August Complex Fire in California, USA, which occurred in a Temperate (Csb) climate zone. Lasting 64 days, from August 15, 2020, to October 17, 2020, this fire affected an area of 2,192 km2.
- Pantanal Fire in Brazil, set in a Tropical (Aw) climate. With a duration of 195 days, from June 25, 2020, to January 5, 2021, it consumed a staggering 21,077 km2 of land.
For every identified fire event, I downloaded a Sentinel-2 image taken prior to the fire and another captured post-fire and masked both to the boundary of the fire. Subsequently, I computed the dNBR in two distinct scenarios: once with the application of BRDF correction to the images and once without incorporating the BRDF correction. Figure 3 demonstrates the dNBR without BRDF correction, the dNBR with BRDF correction, and the difference between the two for each of the above events.
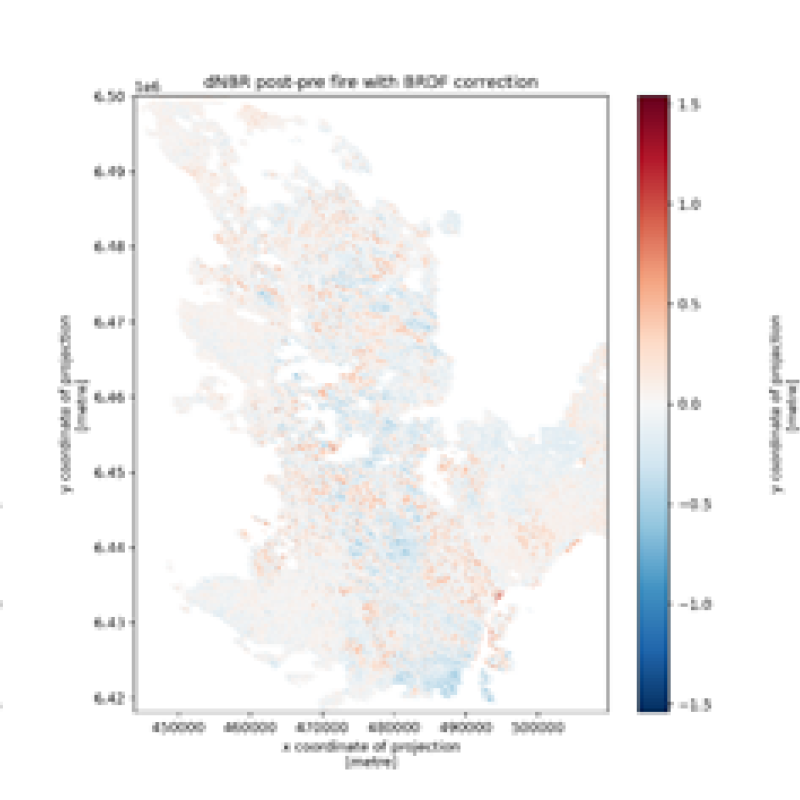
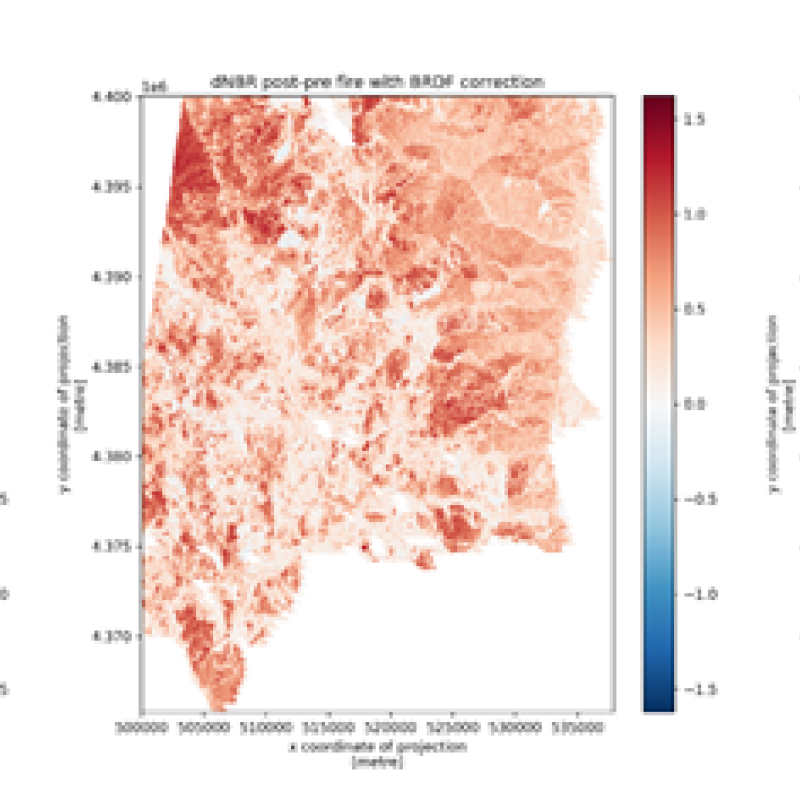
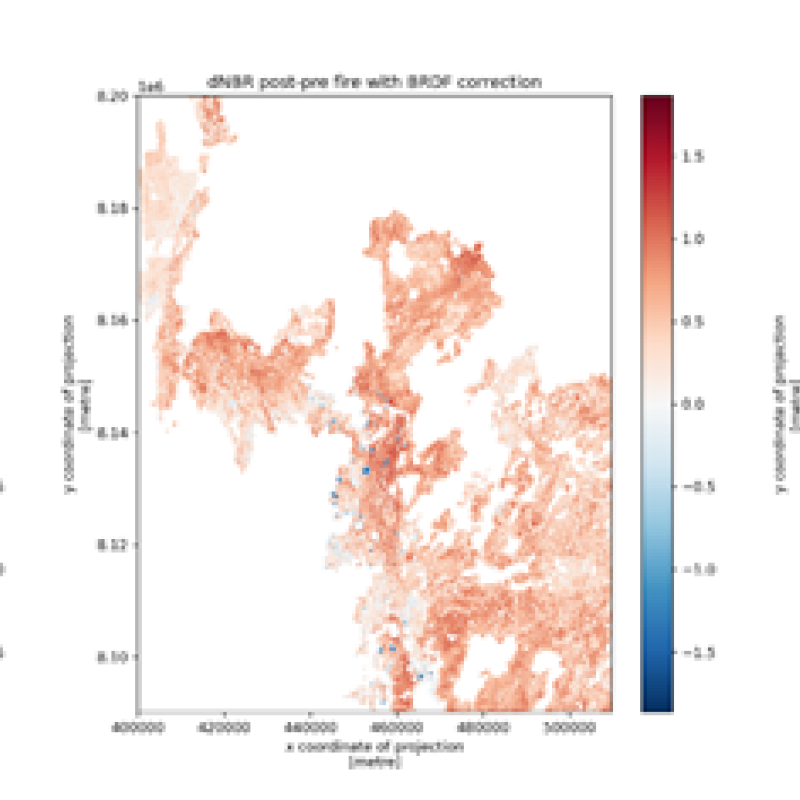
Figure 3. Variation in dNBR with and without BRDF correction for (top) Chuckegg Creek Wildfire, (middle) August Complex Fire, and (bottom) Pantanal Fire.
Figure 4 shows the relationship between the corrected and uncorrected dNBR on the left and the distribution of the percentage change in dNBR as a result of applying the BRDF correction on the right for each event.
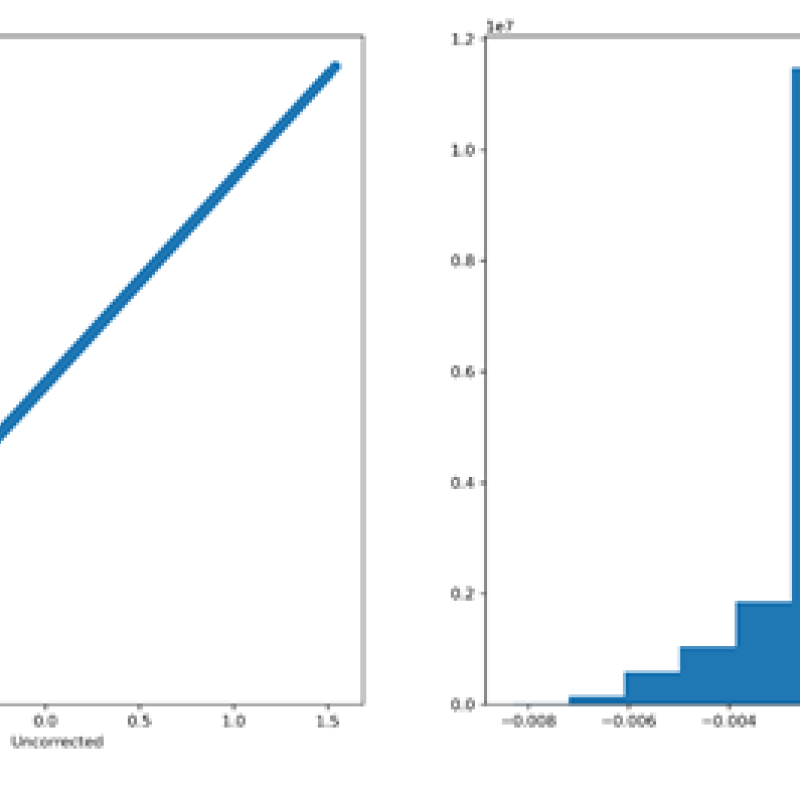
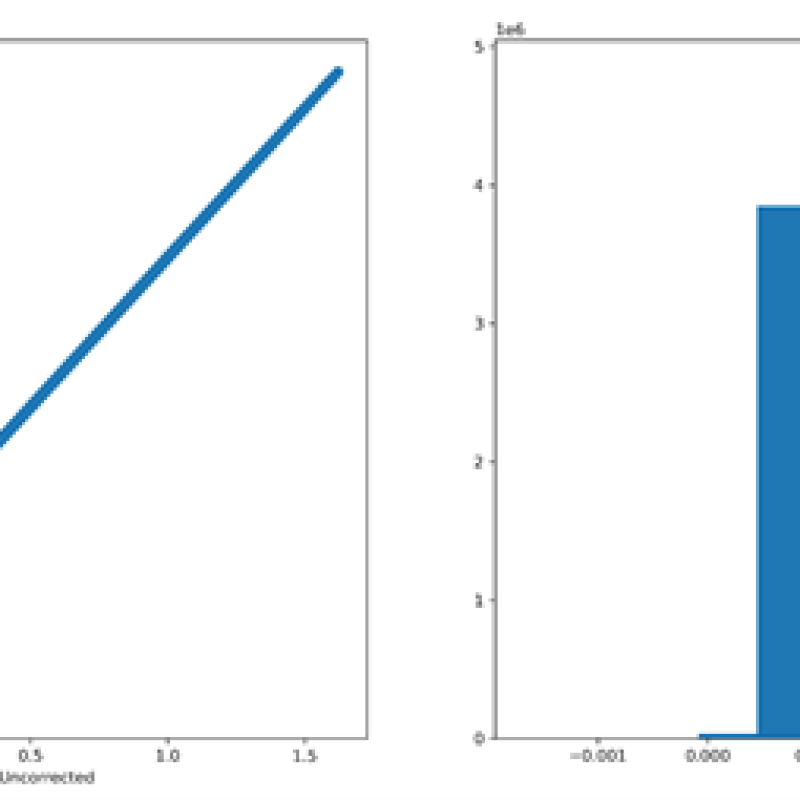
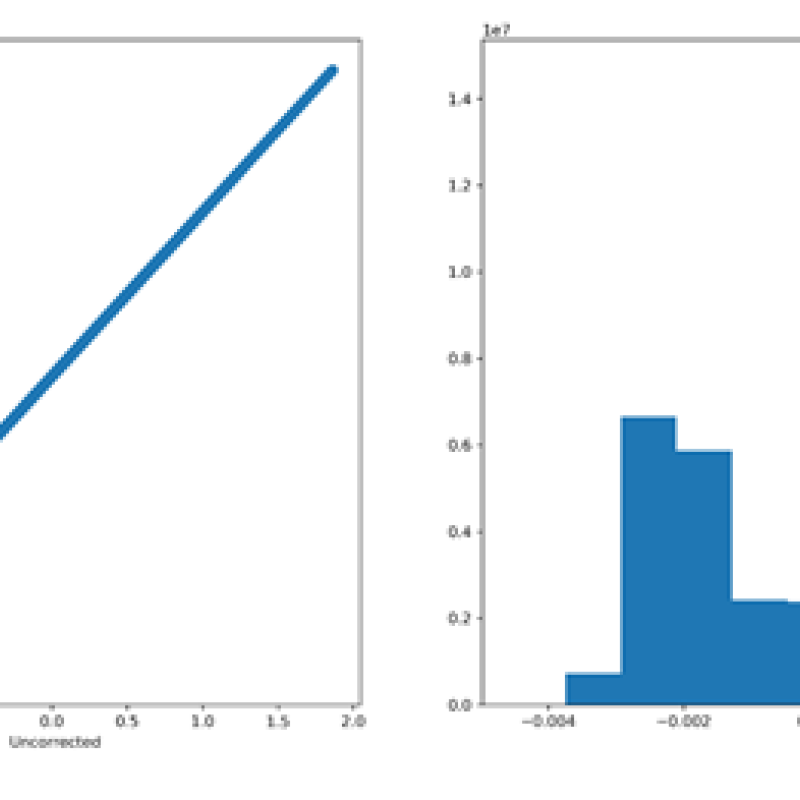
Figure 4. Left) the scatterplot of corrected and uncorrected dNBR and right) the histogram of percentage change in dNBR pre and post-fire for (top) Chuckegg Creek Wildfire, (middle) August Complex Fire, and (bottom) Pantanal Fire.
In concluding our exploration of BRDF correction's influence on dNBR for fire delineation, several observations become apparent. Primarily, BRDF correction doesn’t seem to significantly impact dNBR values within the delineated fire perimeter. Instead, it exhibits a systematic pattern that appears to be consistent across different scenes. This pattern becomes even more discernible when examining entire (non-masked) satellite images. Intriguingly, our findings challenge the assertions made by Roy et al., (2019) [4]. Contrary to their claims, our observations indicate that the variations in reflectance due to directional effects are not significant and might not be necessary, particularly for a near-real-time product.
4. Signal Evaluation for Optical Imagery: Sentinel-2 vs. Landsat-8
The evaluation of optical imagery signals is foundational when it comes to delineating burned areas accurately. While Sentinel-2 and Landsat-8 are both renowned for their capacities in Earth observation, differences in their outputs can lead to variations in how burned areas are classified. To harness the most accurate and comprehensive information, it becomes imperative to understand these distinctions, particularly when aiming for a fusion of optical and SAR imagery.
For this endeavor, I turned to the FiredPy fire perimeters of the three aforementioned fires: the Chuckegg Creek wildfire, the August Complex Fire, and the Pantanal Fire. Utilizing the dNBR, which is the difference between the pre-fire and post-fire NBR values (Eq. 1), I embarked on a comparative analysis of how both Sentinel-2 and Landsat-8 capture and represent this crucial index.
dNBR = NBR prefire - NBR postfire (1)
Similar to the previous step, I masked the images of both satellites to the boundary of the burned areas as derived from FiredPy (as the ground-truth). This ensured that the evaluations and comparisons were solely within the areas of interest, eliminating potential distortions from the surrounding landscapes.
Following this, for each fire event, I delved into a detailed breakdown: calculating the Pre-fire NBR, Post-fire NBR, and the subsequent dNBR. To understand the data distribution and frequency, I calculated the histograms of the dNBR values and mapped them spatially to visualize the patterns of burn and its severity across the landscapes. I then classified the dNBR maps into five distinct categories, representative of the burn's severity based on the classification provided in [5]. These categories spanned Enhanced Regrowth, Unburned, Low Severity, Moderate Severity, to High Severity. Table 1 provides the start and end date of each fire event along with the acquisition dates of prefire and postfire Landsat-8 and Sentinel-2 images. To avoid making this post too long, I only present the results for the Chuckegg Creek wildfire here. If you are interested in seeing other results, please contact me.
Table 1. The acquisition dates of satellite images relative to the fire events.
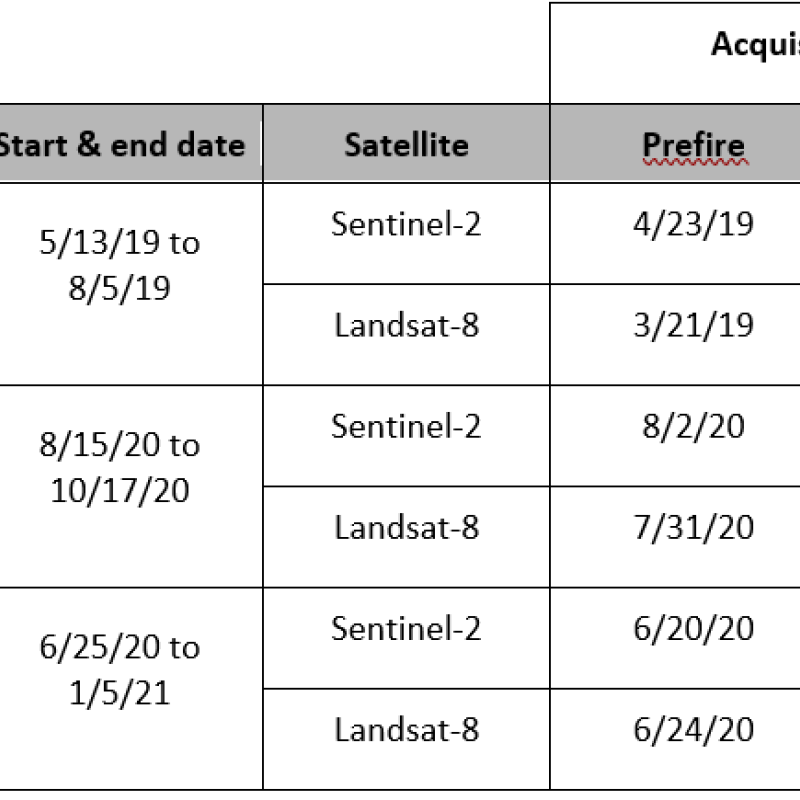
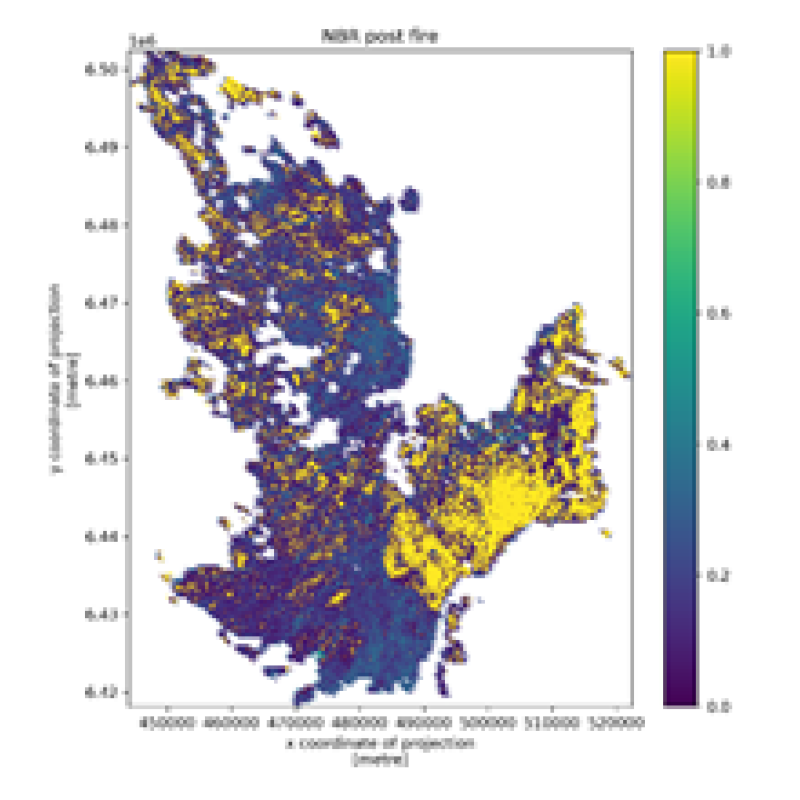
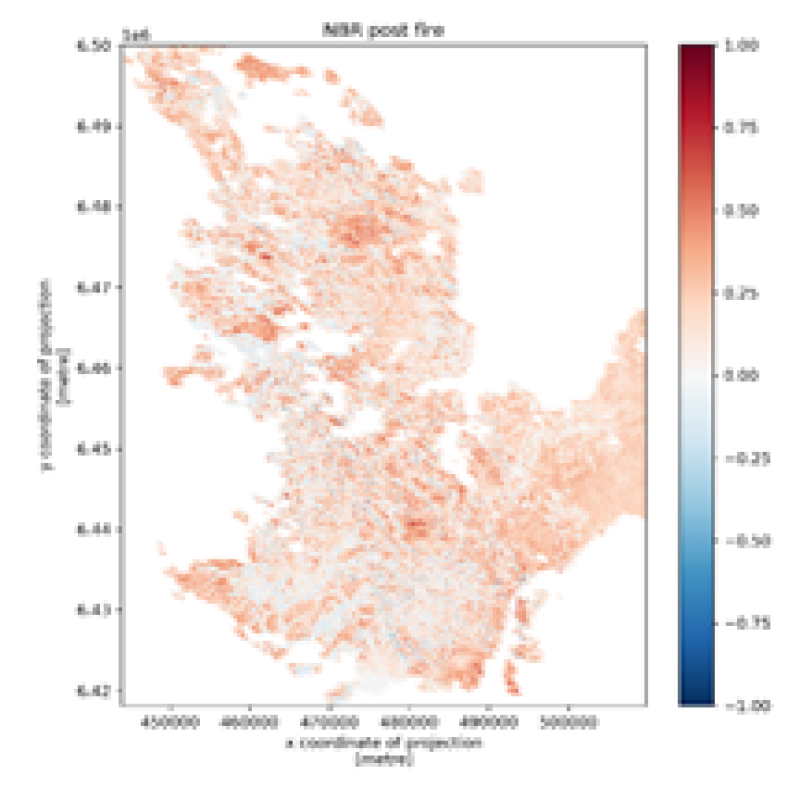
Figure 5. Maps of (right) prefire NBR, (middle) postfire NBR, and (left) dNBR calculated using (top) Landsat-8 and (bottom) Sentinel-2 images.
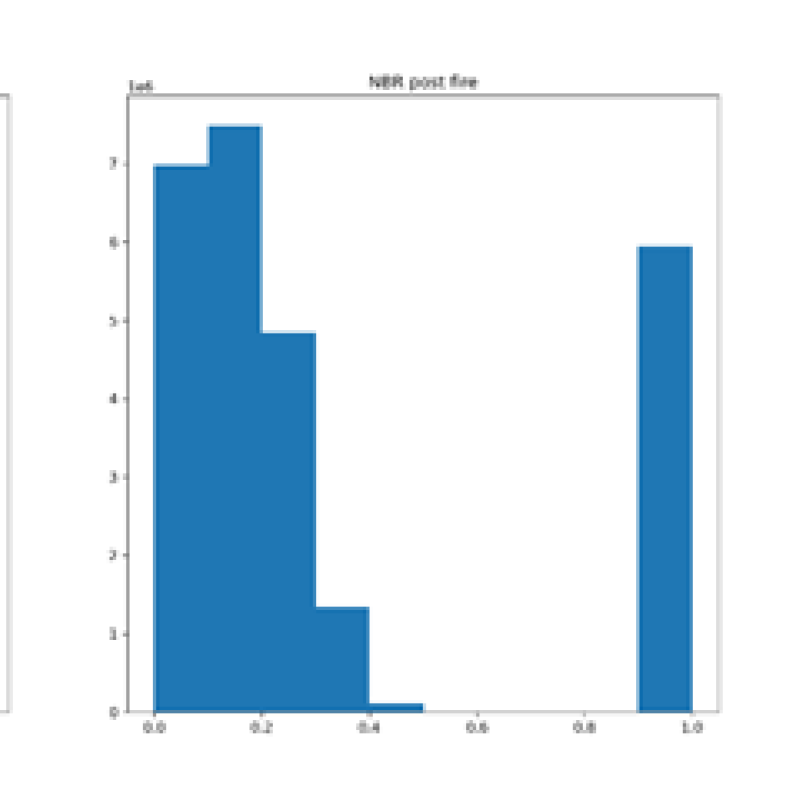
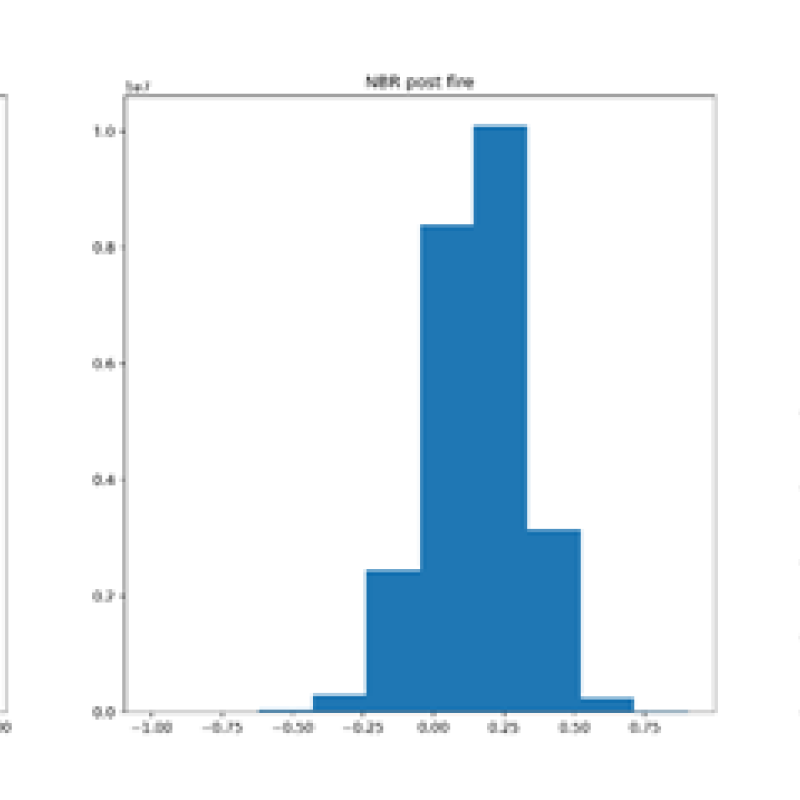
Figure 6. Histograms of (right) prefire NBR, (middle) postfire NBR, and (left) dNBR calculated using (top) Landsat-8 and (bottom) Sentinel-2 images.
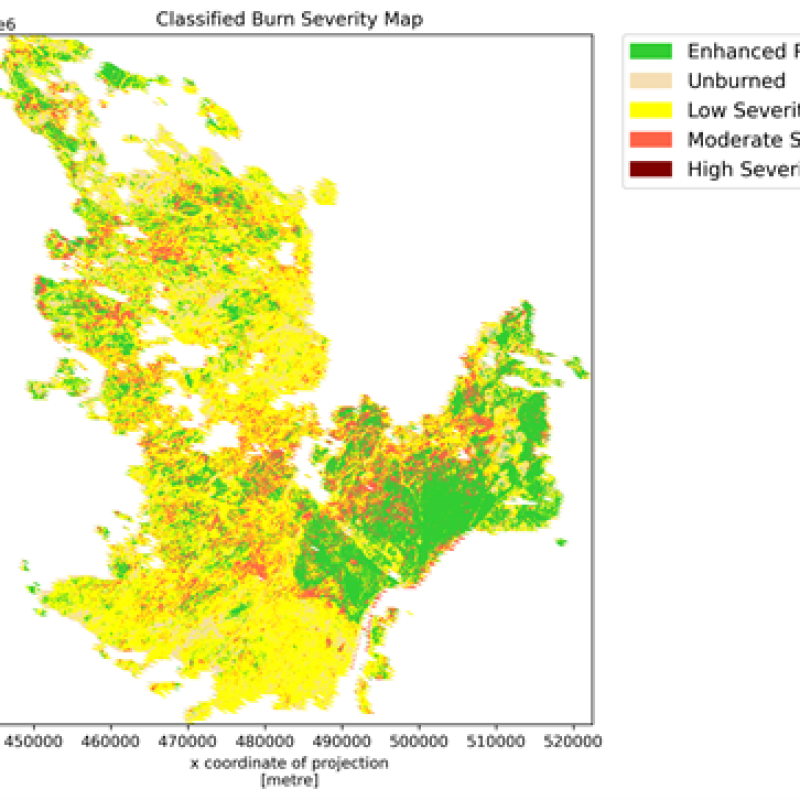
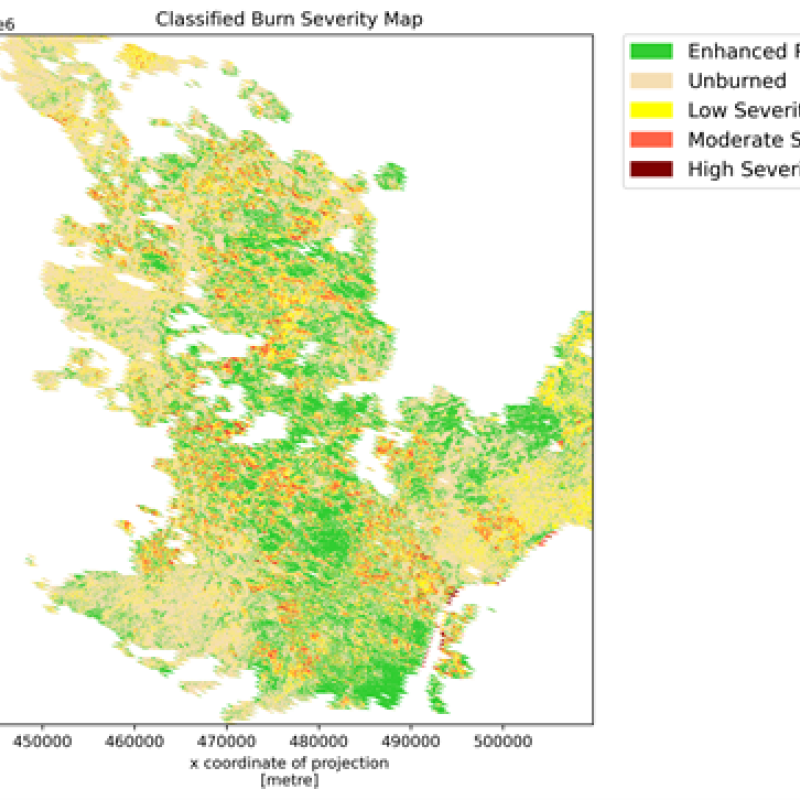
Figure 7. Classified maps of burn severity calculated using (top) Landsat-8 and (bottom) Sentinel-2 images.
In my examination of burned areas where the spatial extents are relatively congruent, Landsat seems to provide a more homogeneous classification of burn severity. The comparisons are, however, not conclusive as the acquisition dates and the footprints of the images do not match perfectly.
However, as I broadened my analysis to other examples, one pivotal realization emerged: the crucial need for both spatial and temporal harmonization between Sentinel-2 and Landsat-8. While both datasets may be masked using an identical boundary, the differing footprints of the respective images generate different output extents. This divergence, in turn, presents analytical challenges when performing a direct comparison between the two.
Adding to the complexity is the discrepancy in acquisition dates for the pre- and post-fire images across the two satellite platforms (Tabel 1). The temporal gap means that the conditions captured might not be directly comparable, adding another layer of uncertainty when assessing which satellite product provides a more accurate depiction.
In essence, while individual merits of Sentinel-2 and Landsat-8 can be noted in isolation, a holistic evaluation mandates a rigorous spatial and temporal alignment (harmonization) to ensure any comparative conclusions drawn are both scientifically robust and meaningful.
5. Conclusions and Future Directions
In this blog post, I shared our initial efforts to create a near-real-time (NRT) fire delineation product. Our findings have highlighted various aspects and challenges, especially when working with different types of satellite imagery. Moving forward, our immediate goal is to compare the data from optical images with that of Sentinel-1 SAR. Following that, we aim to address the challenges related to merging optical and SAR images, particularly ensuring they align correctly in terms of time and space.
As we map the future trajectory of this research, two main areas need more attention:
- Deep Learning-Based Semantic Segmentation for Burned Area Detection:
Employing deep learning techniques can enhance our ability to identify burned areas. In the future, we might focus on semantic segmentation of burned areas using either single-source optical images, or by fusing optical imagery with SAR data, specifically Sentinel-1. - Spatial and Temporal Data Harmonization:
When working with multiple satellite image sources, it's vital to make sure the data aligns in space and time. Setting up this alignment could be its own research project. The goal would be to ensure that the information from different image sources matches up consistently.
In summary, the work showcased here represents a stepping stone. The avenues for refinement and exploration are vast, promising robust advancements in our understanding and delineation of fire events.
References
[1] Balch, J. K., St. Denis, L. A., Mahood, A. L., Mietkiewicz, N. P., Williams, T. M., McGlinchy, J., & Cook, M. C. (2020). FIRED (Fire Events Delineation): an open, flexible algorithm and database of US fire events derived from the MODIS burned area product (2001–2019). Remote Sensing, 12(21), 3498.
[2] Mahood, A. L., Lindrooth, E. J., Cook, M. C., & Balch, J. K. (2022). Country-level fire perimeter datasets (2001–2021). Scientific data, 9(1), 458.
[3] Hawbaker, T. J., Vanderhoof, M. K., Schmidt, G. L., Beal, Y. J., Picotte, J. J., Takacs, J. D., ... & Dwyer, J. L. (2020). The Landsat Burned Area algorithm and products for the conterminous United States. Remote Sensing of Environment, 244, 111801.
[4] Roy, D. P., Huang, H., Boschetti, L., Giglio, L., Yan, L., Zhang, H. H., & Li, Z. (2019). Landsat-8 and Sentinel-2 burned area mapping-A combined sensor multi-temporal change detection approach. Remote Sensing of Environment, 231, 111254.
[5] Wasser L. (2018). earthlab/earth-analytics-r-course: Earth Analytics Course in the R Programming Language (r-earth-analytics). Zenodo. https://doi.org/10.5281/zenodo.1326873. Accessed online here on Aug. 2023.