Wildfire Air Pollution and Health
Developing an air pollution model and health response models allows us to link air pollution exposures with health data and determine which concentrations of pollutants are either exacerbating or causing various respiratory and cardiovascular health burdens.
Introduction
The 2018 wildfire season in California has been the most destructive on record. More than 7,500 fires have burned nearly 1.7 million acres, causing more than $2.975 billion in damages. This season has also raised public concern about the health impacts of smoke inhalation.
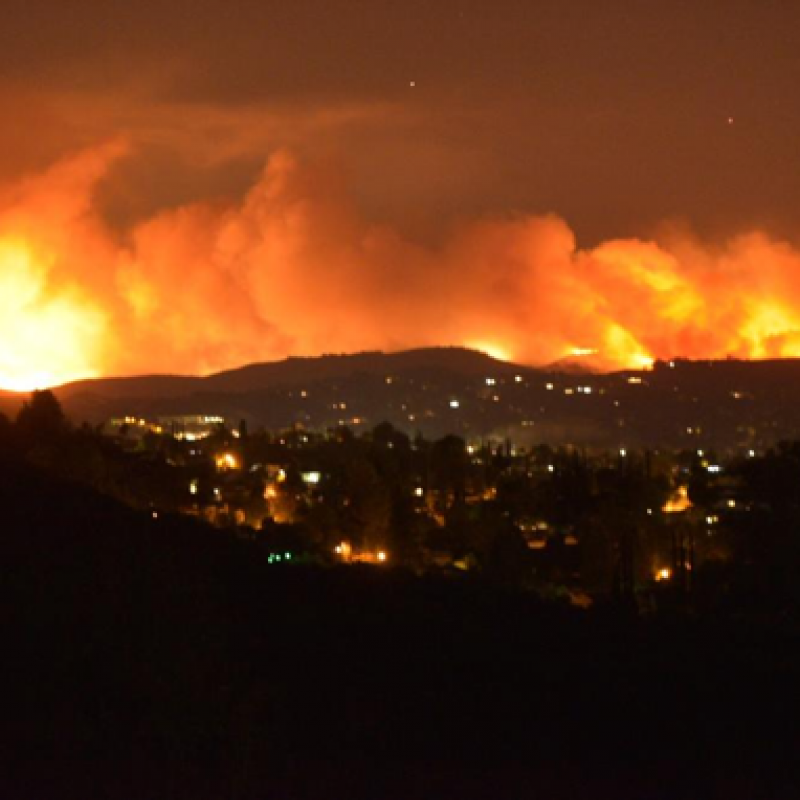
Source: NBC Los Angeles
My research team investigates the impact of air pollution from wildfires on human respiratory and cardiovascular health in the western US. For more context on our research aims, data sources, and policy implications, check out my previous blog post Wildfires: A Rapidly Growing Problem. Since I wrote that post, our environmental health team has been making headway in modeling both exposure to air pollution and associated health responses. Developing an air pollution model and health response models allows us to link air pollution exposures with health data and determine which concentrations of pollutants are either exacerbating or causing various respiratory and cardiovascular health burdens.
Creating Air Pollution Exposure Models
Two of the most concerning air pollutants generated by wildfires are fine particulate matter (PM2.5) and ground-level ozone (O3). Previous studies have indicated significant health burdens associated with inhaling PM2.5 and O3, but left room for improvement in modeling exposures to these air pollutants. To generate more accurate estimations of air pollution exposure, our team is taking a big data approach and using a variety of machine learning methods. After retrieving huge environmental data sets---such as ground-level air quality data and remotely-sensed imagery that measures aerosol loading in the air column---from public repositories and processing these data into useful formats, we run an ensemble of machine learning algorithms. This allows for learning from existing data and making predictions for spatio-temporal points where we don’t have air quality monitoring data.
For a current project modeling air pollution in 11 western states between 2008 and 2014, we are in the midst of testing and improving this ensemble model. Since May 2018, I have worked on gathering and processing some of these data sets, pulling everything together in R and Python, and learning the intricacies of the machine learning package our team is using.
Data Challenges
Major challenges we’ve faced in gathering and processing these data sets are lack of documentation, the large quantity of data, and the need to create efficient and reproducible open-source data science pipelines. Several of the remote sensing products I have processed (such as GOES-West Aerosol and Smoke Product aerosol optical depth) did not have clear documentation, so it required a lot of experimentation and emailing to figure out how the data were even formatted.
Then, once we knew how to access the information in each file, each of our team members has struggled with determining efficient ways of processing the various data sets. Especially when you’re on the learning curve with earth data science, it takes time to develop familiarity with even the most common packages, and lots of revisions to utilize these tools efficiently. We are very grateful to the Earth Lab Analytics Hub for guidance in coding and using Amazon Web Services.
Earth Lab in general has facilitated our use of modern data science tools and encouraged us to perform open and reproducible science. In the short-run, this adds work in needing to document everything and write accessible code, but in the middle- and long-run we anticipate that this will be very beneficial for our own research as well as other environmental and health science groups who want to use our air pollution exposure data set and predictions for other applications. Already, we are extending our study to include years 2015-2018 (due to the massive fires in the western US in the last few years), and our largely-automated workflow greatly facilitates this extension.
Machine Learning
To learn patterns in the environmental data and be able to predict air pollution exposure at locations without air quality monitoring data, we have thus far experimented with random forest. Random forest uses an ensemble of decision trees trained on different subsets of the data to reduce overfitting of a model. This allows for less rigid (and often more accurate) test results. The machine learning package we are using, caretEnsemble in R, facilitates running many kinds of machine learning algorithms with cross-validation and tuning hyperparameters. Cross-validation is a technique which allows us to train and test our model on different subsets of the data, then combine their results. Hyperparameters are model parameters which control things like the number of subsets of the data that we use in cross-validation, and must be determined through trial-and-error. Many machine learning packages increase the efficiency of these processes. However, even with efficient methods, our first random forest and GLM attempts have taken a long time to process because of the large amount of training data we have.
It will be interesting to see whether our results align with those from a past study(2) by Dr. Colleen Reid (our environmental health team’s principal investigator). That study focused only on air pollution from the 2008 northern California wildfires, so it is possible that we will see differences in the best-performing machine learning models based on our much larger spatio-temporal coverage and inclusion of some other fine-resolution variables that were not included in the earlier study, such as 1km-resolution aerosol optical depth from the MAIAC satellite product. One direction we’re considering is to use convolutional neural networks on our remotely-sensed variables, which might help quantify spatial patterns in air pollution.
Health Response
Quantifying these air pollution exposures allows us to investigate the associations between PM2.5 and O3 and rates of health burdens such as asthma, chronic obstructive pulmonary disease (COPD), and pneumonia. In particular, having an air pollution model that is continuous in time and space allows us to estimate exposures regardless of the presence of air quality monitors (which are often sparse).
The value of quantifying these air pollution exposures is that we can thereafter discern the associations between PM2.5 and O3 from wildfires and rates of asthma, chronic obstructive pulmonary disease (COPD), and pneumonia - among other health burdens - throughout the study region, regardless of monitoring presence. I have had the chance to learn about such epidemiological analyses in a second project with Dr. Reid which studies the 2008 northern California wildfires. To our knowledge, this study is one of the first to investigate the impact of O3 from wildfires on health.(1)
In the analyses, we use generalized linear models (standard epidemiological regressions) to calculate relative risk of each health outcome associated with certain amounts of exposure. We account for confounding factors such as temperature, smoking rate, and percent of the population over age 65. These regressions can also incorporate effect modification, which allows us to analyze differential health impacts associated with air pollution between socioeconomic-demographic groups.
Our analysis showed that PM2.5 was significantly associated with exacerbations of asthma and COPD even after controlling for O3.(1) Meanwhile, the significance of associations between O3 and asthma and COPD hospitalizations or emergency department visits disappeared after controlling for PM2.5, probably because high levels of PM2.5 during the fires drowned out the lower O3 health signal.(1)
Below is an example of our results for emergency department visits. We see that for ozone, there were significant increases in the combined respiratory and acute respiratory infection categories after the fires. For PM2.5, there were significant increases in combined respiratory, asthma, and COPD during the fires.

Relative Risk (RR) of Emergency Department visits before, during, and after the 2008 northern California wildfires; mutually-adjusted models for O3 and PM2.5.
In assessing effect modification by socioeconomic-demographic groups, we found significant exacerbations of asthma associated with PM2.5 during wildfires in ZIP codes with all levels of various socioeconomic-demographic variables. We also found significant increases in COPD more strongly in economically disadvantaged ZIP codes, ZIP codes with lower levels of immigration, and those with moderate levels of racial diversity. Quantifying these health impacts may inform planning for public health messaging during future wildfire events.
Below is an example of our results for emergency department visits modified by median income. Because of the strong association between PM2.5 and asthma, all income levels experienced significant increases in asthma. However, only the lowest-income tertile experienced a significant increase in COPD.
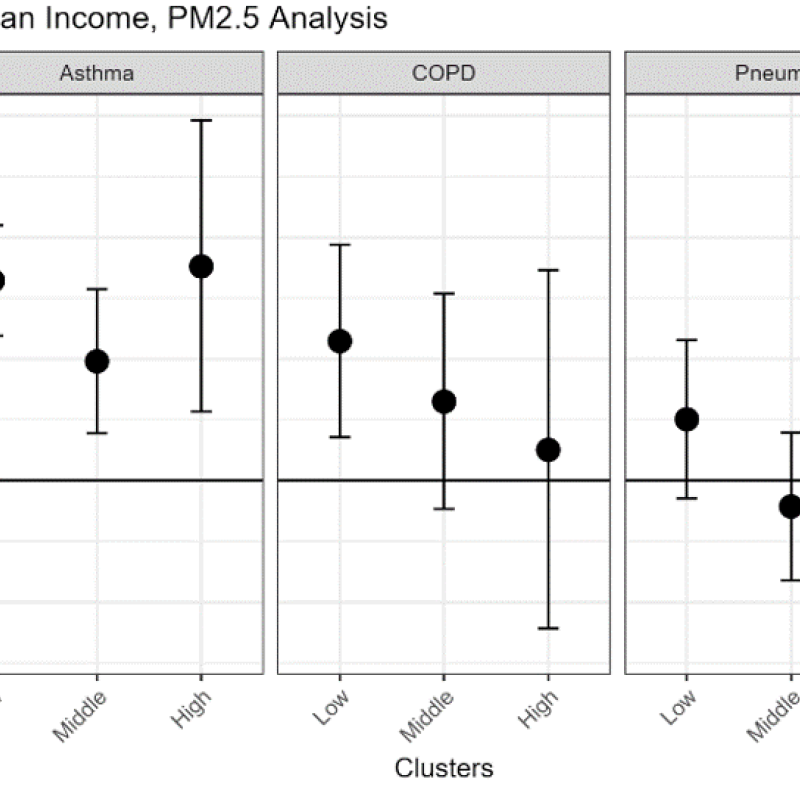
Effect modification by median income of emergency department visits in the PM2.5 model
Mathematical Modeling, Interpretation and Epidemiology
Adapting R code to perform all of these analyses has required me to investigate and understand the mathematical underpinnings of each statistical method. One thing I’ve been surprised to learn about is the concern in health modeling that standard epidemiological regressions are frequently too simple -- often assuming linear relationships between exposures of interest and health outcomes.
However, many health researchers are wary of more complex methods because of the opaqueness of output from the algorithms. Many machine learning methods (such as those my team is using in exposure modeling) produce estimates without revealing the relationships between the predictor and outcome variables. Acting on health predictions for which the foundation cannot be checked for biological plausibility is considered risky. Moving forward, there is great opportunity for the development of robust machine learning methods which facilitate interpretation.
Resources
- Reid CE, Jerrett MLB, Considine EM, Watson G, Telesca D, and Pfister G. 2018. Associations between ozone and fine particulate matter with respiratory health during a wildfire event. [Soon to be submitted]
- Reid CE, Jerrett M, Tager IB, Petersen ML, Mann JK, and Balmes JR. 2016. Differential respiratory health effects from the 2008 northern California wildfires: A spatiotemporal approach. Environmental Research 150 (2016): 227-235.
- Reid CE, Jerrett M, Petersen ML, Pfister GG, Morefield P, Tager IB, Raffuse SM, and Balmes JR. 2015. Spatiotemporal prediction of fine particulate matter during the 2008 northern California wildfires using machine learning. Environmental Science & Technology 49(6):3887-96