The Burn Is Just the Beginning
Read about how the Burn is Just the Beginning in this blog by Katherine Valentine, CAST
Introduction:
Wildfires have been a natural facet of the Western U.S. landscape, but have grown more intense, unpredictable, and uncontainable in recent decades. We often think of wildfire as the end of the disaster, but in reality, it's just the beginning. Post-fire erosion, landslides, and long-term ecological disruption are permanently reshaping the topography. This study focuses on the cyclical nature between wildfires and the resulting terrain vulnerability. Through modeling, we identify the areas most likely to suffer from these disturbances, witnessing the evolution of risk and recovery in our changing climate.
Study Area:
In June 2002, Colorado experienced one of its largest recorded wildfires in the state’s history. The Hayman Fire ignited near Lake George and would go on to burn more than 138,000 acres across the Front Range. Hayman Fire’s flames were extinguished by the end of July, but left lasting effects on the ecosystems as well as triggering changes to the surrounding topography. Wildfires are an increasingly prominent disturbance within the state, driven by hotter conditions, shifting precipitation patterns, and longer fire seasons. A new challenge presents itself: understanding how burned landscapes recover and where the land is most vulnerable. To answer this question, I used geospatial layers of land cover, elevation, slope, and burn severity to model post-fire geomorphic risk.
Data:

These figures show mean slope and elevation within the northern transects. The sidebar color scale ranges from darker (lower) to lighter (higher) values, with transects oriented by geographic location.
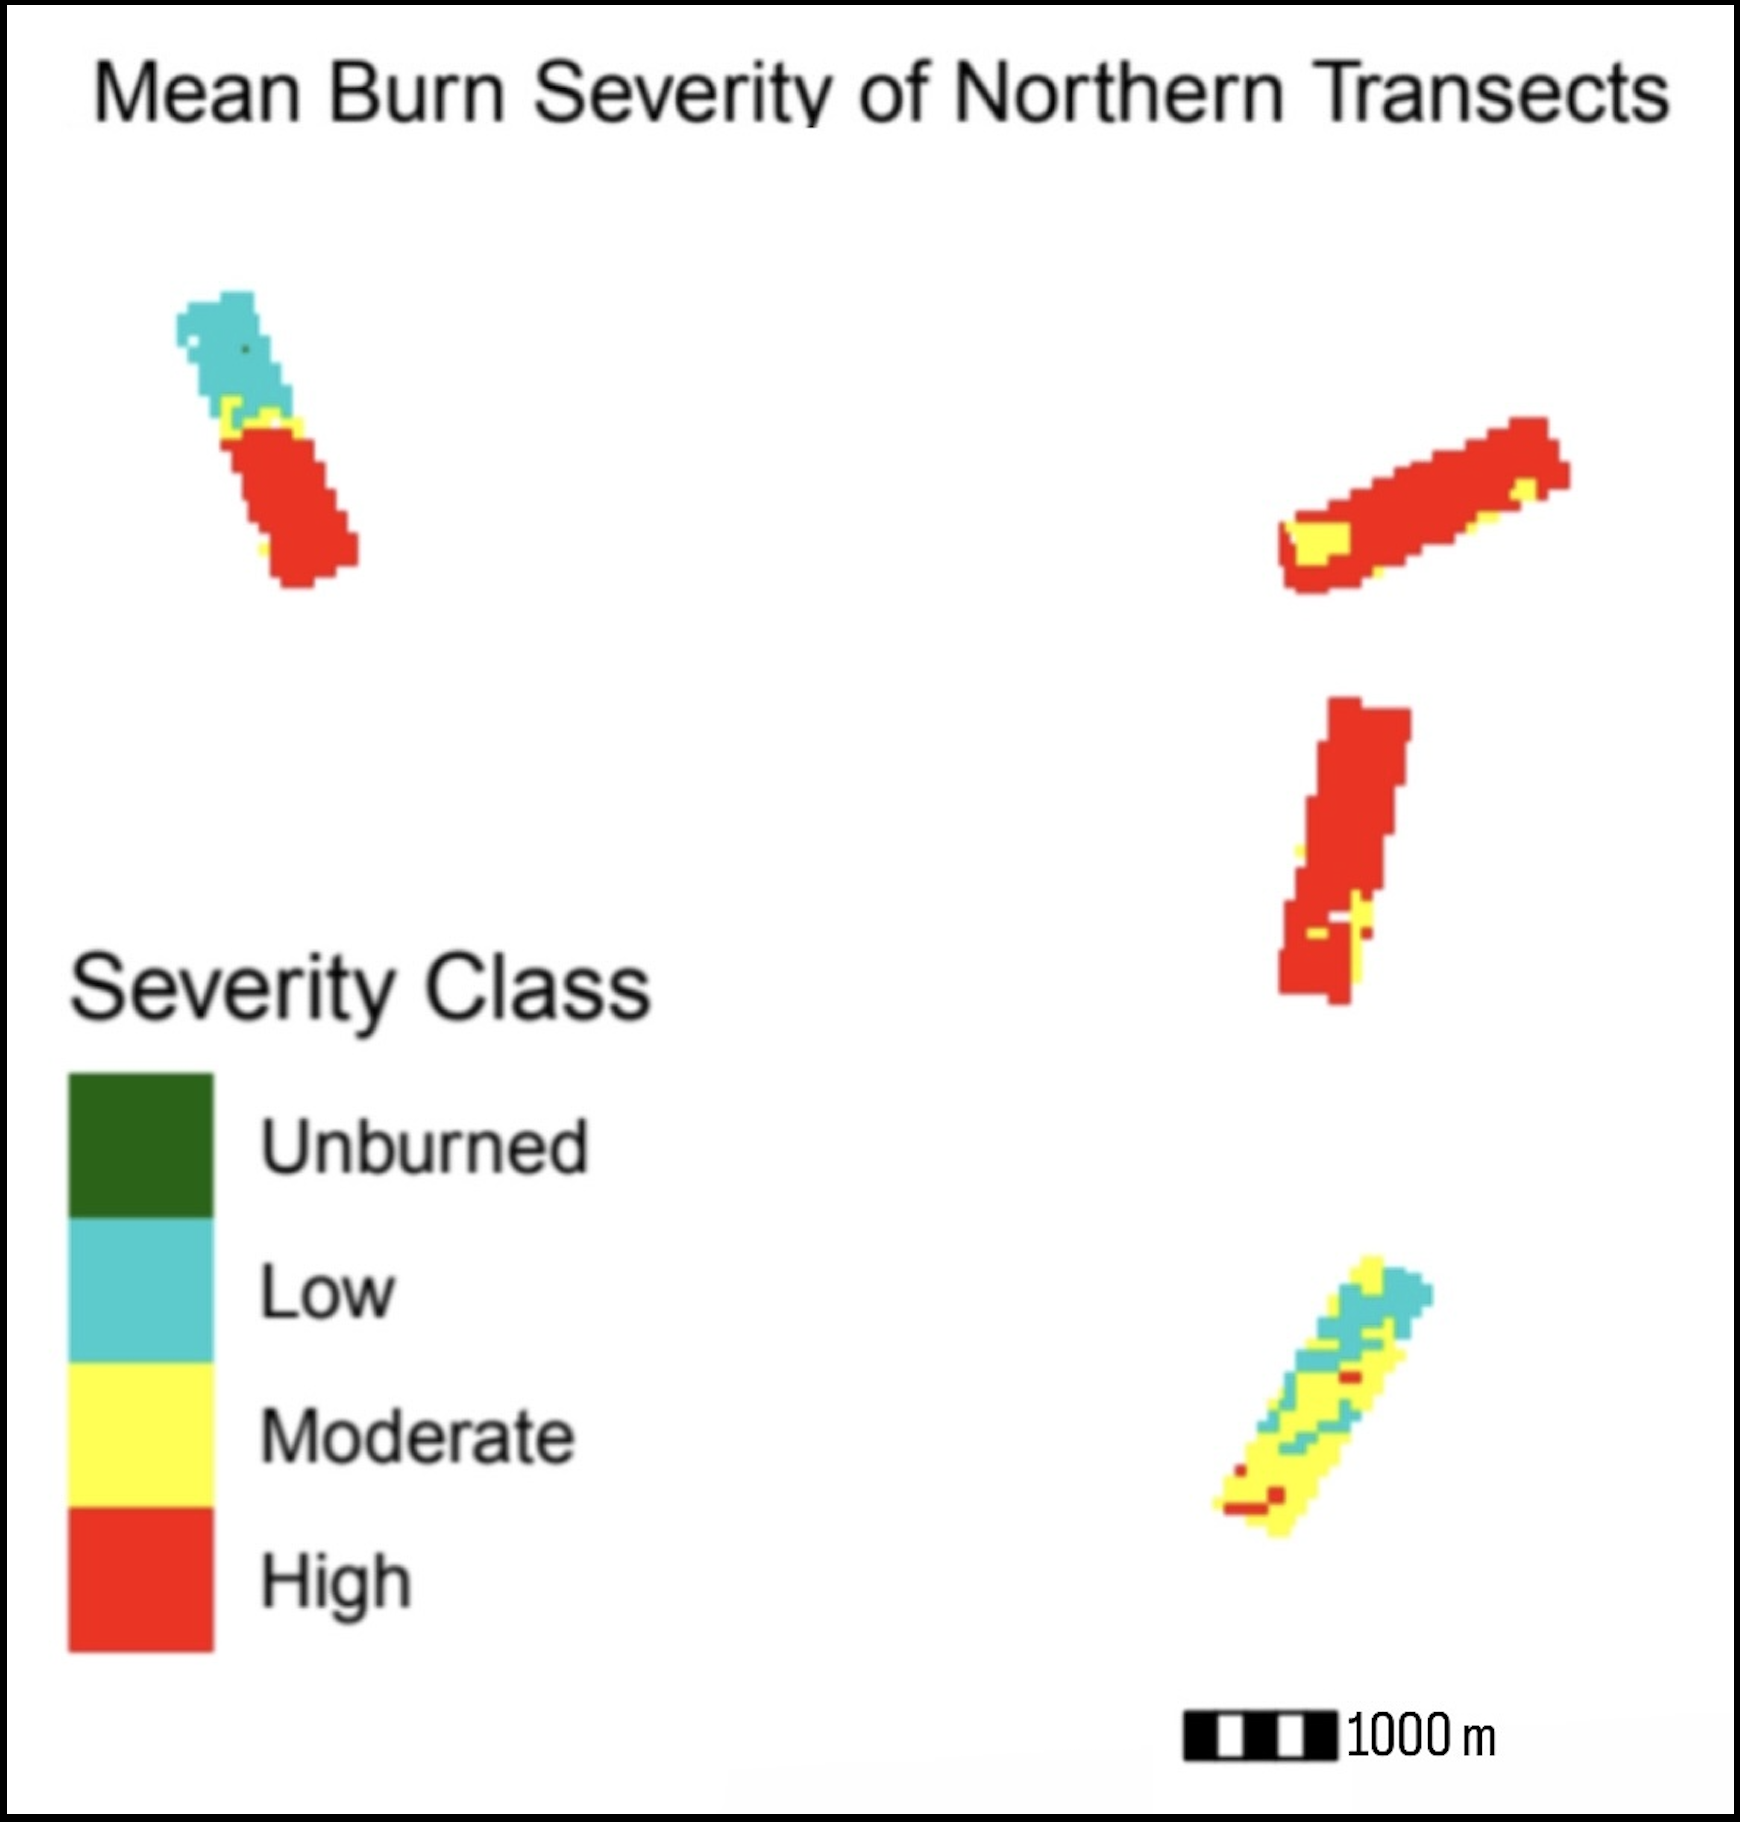
This figure shows the classified mean burn severity of the Northern transects.
To study the long term post wildfire recovery, Earth Lab’s NSF CAREER team had established several Unmanned Aerial Systems (UAS) data collection transects (200m x 800 m) across a range of fire severity and topographic gradients. I focused on the Northern four transects as they experienced the greatest range of burn severity, demonstrating an average change of terrain susceptibility to erosion over time. I observed both pre and post-fire periods with data stretching from 1997 to 2020.

These figures show the above-threshold risk of transects over time and the mean composite risk over time.
A surprising insight found from modeling the mean geomorphic risk over time was that the highest average risk occured in 1997, five years pre-fire. This doesn’t negate the impact of the fire but rather illuminates the susceptibility of failure-prone terrain. The area of Hayman is characterized by shallow soils and jagged granite outcrops which leaves it vulnerable to erosion under normal conditions. The fire itself began during a record long drought in the region combined with consistent low humidity, high winds, and overgrown conifer forests, resulting in over three weeks of active burning. The equation used to calculate geomorphic risk was:
( 0.4 * "Slope@1" / 90 ) + ( 0.4 * "Summed_CBI@1" / 3 ) + ( 0.2 * "Landcover_year@1" / 8 )
This combination of heavily weighted slope and CBI (composite burn index) in comparison to yearly landcover generated the greatest risk pre-fire in 1997 due to the already hazard-primed steep slopes and soil conditions. The elevated level of risk still persisted post-fire, but I observed a faster vegetational recovery post-fire than predicted. The classes of land cover experienced a quick shift from forest to shrub/grassland after the disturbance, which remained through 2020.
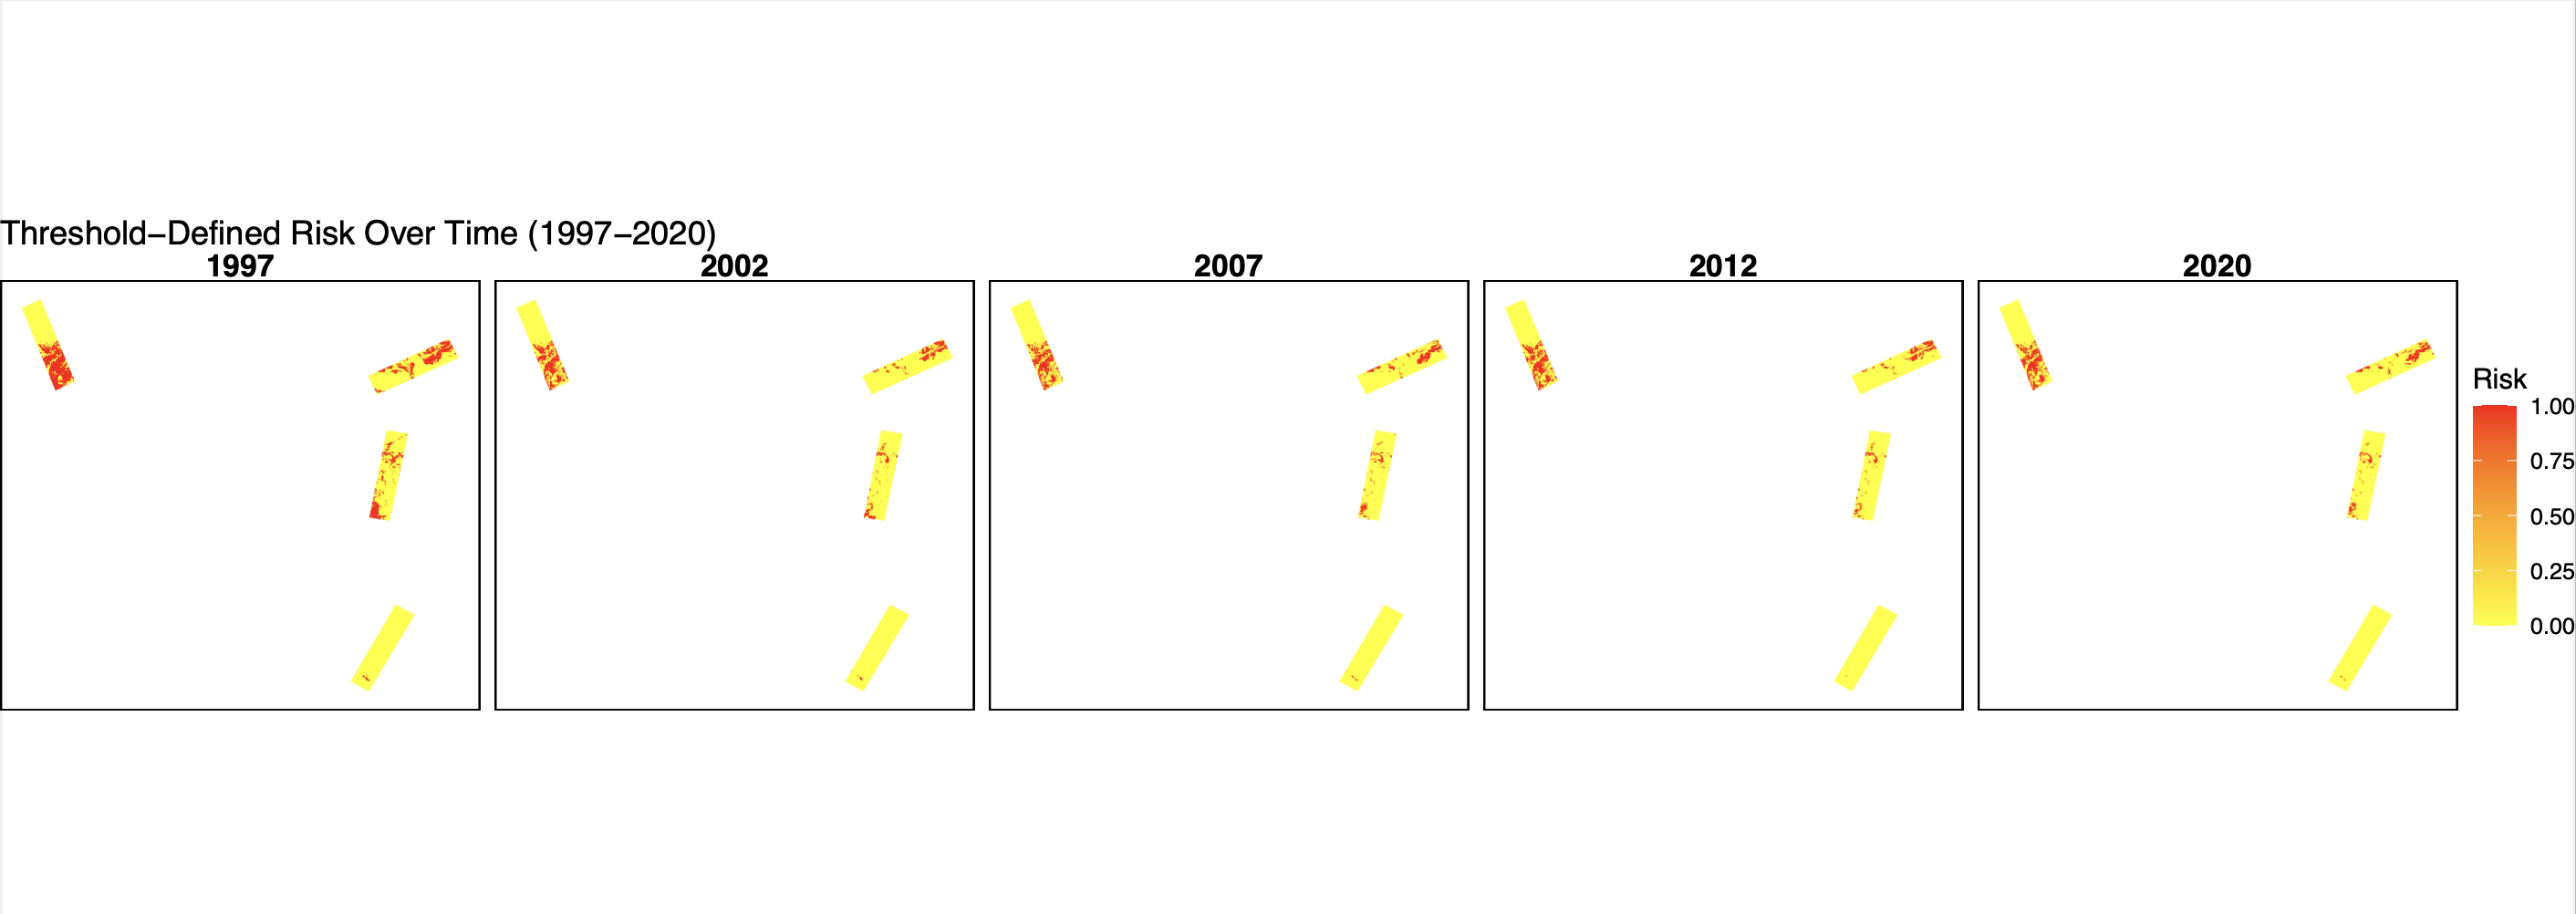
These figures represent the threshold defined risk over time from 1997-2020 with the key indicating lower risk in yellow and higher risk in red.
Once I established the mean composite risk index of each year, I defined a threshold of 0.55 to determine which areas were “high” risk. This highlighted the visual change we observe from the scatterplots shown before. 1997 was when vulnerability peaked due to a combination of barren rock, sparse vegetation, and by 2002, the ecosystem became disrupted by the fire as well. Partial stabilization began in 2012 and risk slightly decreased by 2020, however, some burn scars still remain above threshold 20 years after the disturbance.

This figure demonstrates how mean composite risk varies with elevation, slope, and aspect.
The General Additive Model assessed the vulnerability of the terrain factors. As seen above, elevation had a nonlinear effect on risk factor, and mid elevations (~2300–2400 m) saw the greatest correlation to risk. Looking at the different perspectives of aspect of the model, we see they did not have much variation or contribute a strong nonlinear relationship. However, the nearly linear positive relationship of slope follows predictions as the steeper slopes allow fire to spread more rapidly and ignite easily.
Results:
These findings reinforce the importance of topography, specifically slope and elevation, as predictors of geomorphic vulnerability. The burn severity and land cover appear to modify the degree of risk in previous models, but do not dominate them. The story of this area tells us that it's not just about how the landscape burns, but where. Another factor is that risk doesn’t always peak immediately after a fire, the preexisting structure of the land is crucial to consider in terms of restoration efforts.
The landscape and legacy that Hayman left behind teaches us the uniquely complex cycle of recovery. Post-fire, the vulnerability increased dramatically with the U.S. Forest Service reporting many slopes lost nearly all their surface vegetation. Root structures were so degraded in the high burn severity locations that soil slippage became a major concern (USDA Forest Service 2003). Local stream channels were transformed from running clear to black from the ash and fine sediment deposited during summer storms [Robichaud PR, MacDonald L, Freeouf J, Neary DG, Martin D. 2003.]. The land wasn’t just temporarily burned, it was physically reshaped. Even decades post-fire, some areas remain unstable due to the slow vegetational rebound and persistent hydrophobic soils. These conditions demonstrate why geomorphic modeling is crucial for post-fire recovery and restoration. This isn’t just about predicting the next problem, it’s about timing our response so we can adapt to our landscapes and protect vulnerable communities.
Acknowledgments:
This research was supported by the National Science Foundation under the CAREER grant (1846384) and by the USGS G22AC00089 grants. Special thanks to Dr. Nayani T. Ilangakoon and Dr. Matthew W. Rossi for their mentorship and contributions to this project.
References
McGuire LA, Rengers FK, Kean JW, Staley DM, Tang H, Youberg A. 2019. Looking through the window of disturbance at post‑wildfire debris‑flow hazards. In: Seventh International Conference on Debris‑Flow Hazards Mitigation; 2019 June 10‑13; Golden, CO; p. 516–523 [cited 2025 Sep 5]. Available from: https://nrfirescience.org/resource/21229
Robichaud PR, MacDonald L, Freeouf J, Neary DG, Martin D. 2003. Hayman Fire case study: summary. Fort Collins (CO): Rocky Mountain Research Station, U.S. Department of Agriculture, Forest Service; [cited 2025 Sep 5]. Available from: https://forest.moscowfsl.wsu.edu/engr/library/Robichaud/Robichaud2002d/2002d.pdf
USDA Forest Service. 2003. Postfire rehabilitation treatment effectiveness: Hayman Fire case study. Fort Collins (CO): Rocky Mountain Research Station, U.S. Department of Agriculture, Forest Service; [cited 2025 Sep 5]. Available from: https://www.fs.usda.gov/rm/pubs/rmrs_gtr114.pdf