A Hidden World Beneath the Waves
Discarded Seafloor-objects: A Hidden World Beneath the Waves
A Project by Allison Buchanan and Robyn Marowitz
Our Data
AWOIS Wrecks & Electronic Nautical Charts
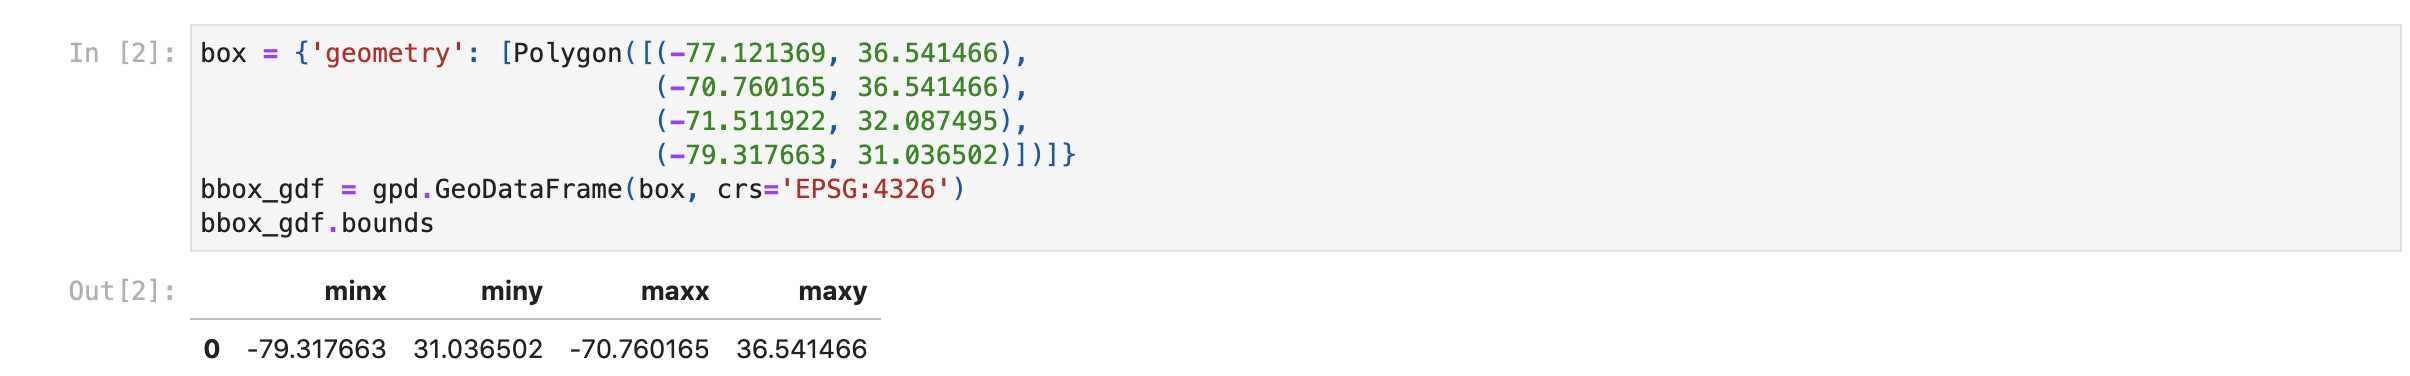
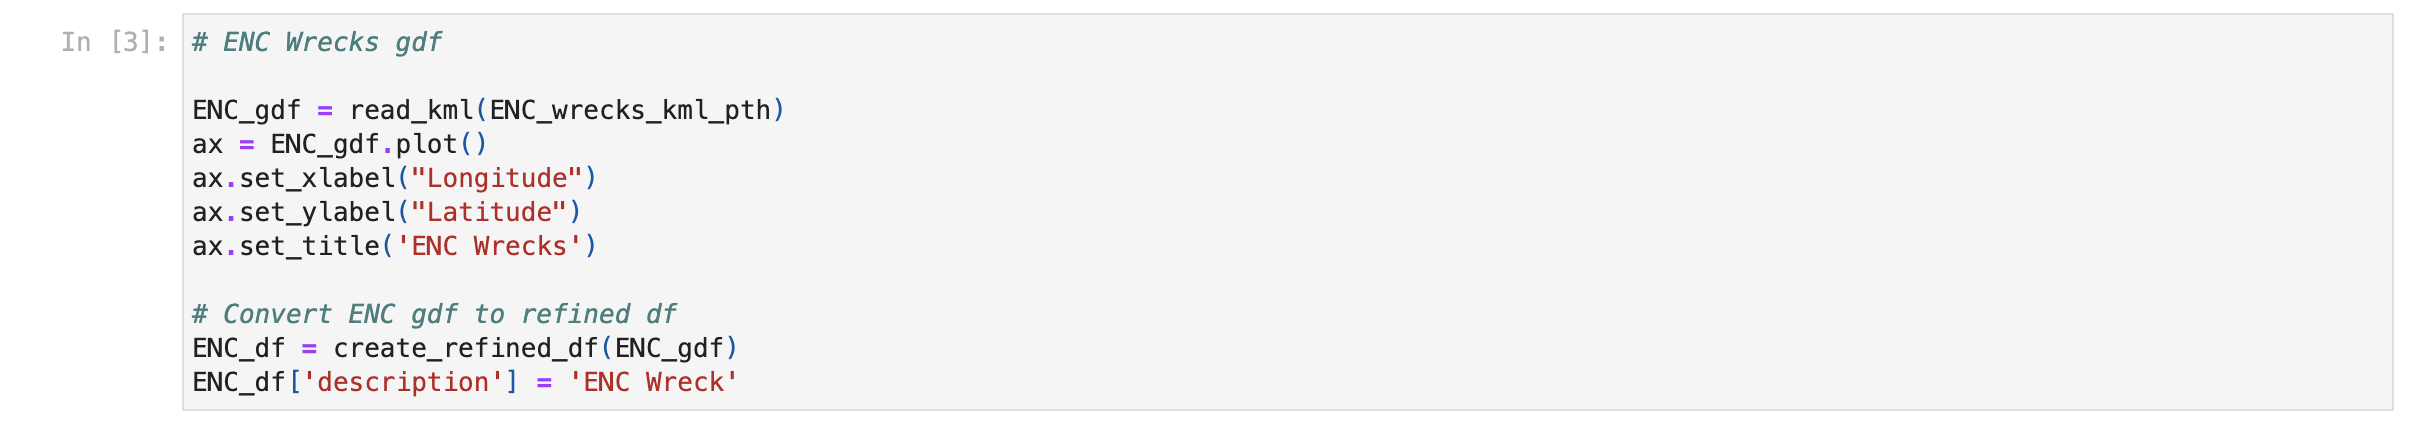
This data comes from the Wrecks and Obstructions Database, managed by the Office of Coast Survey, as well as from Electronic Nautical Charts (ENC's are what the AWOIS database moved towards in 2016). There are over 10,000 wrecks and obstructions managed through this database. We got this data as an excel spreadsheet initially, then decided to use the KMZ (KML) file that was also avialble for consisitency with the Reef Data.
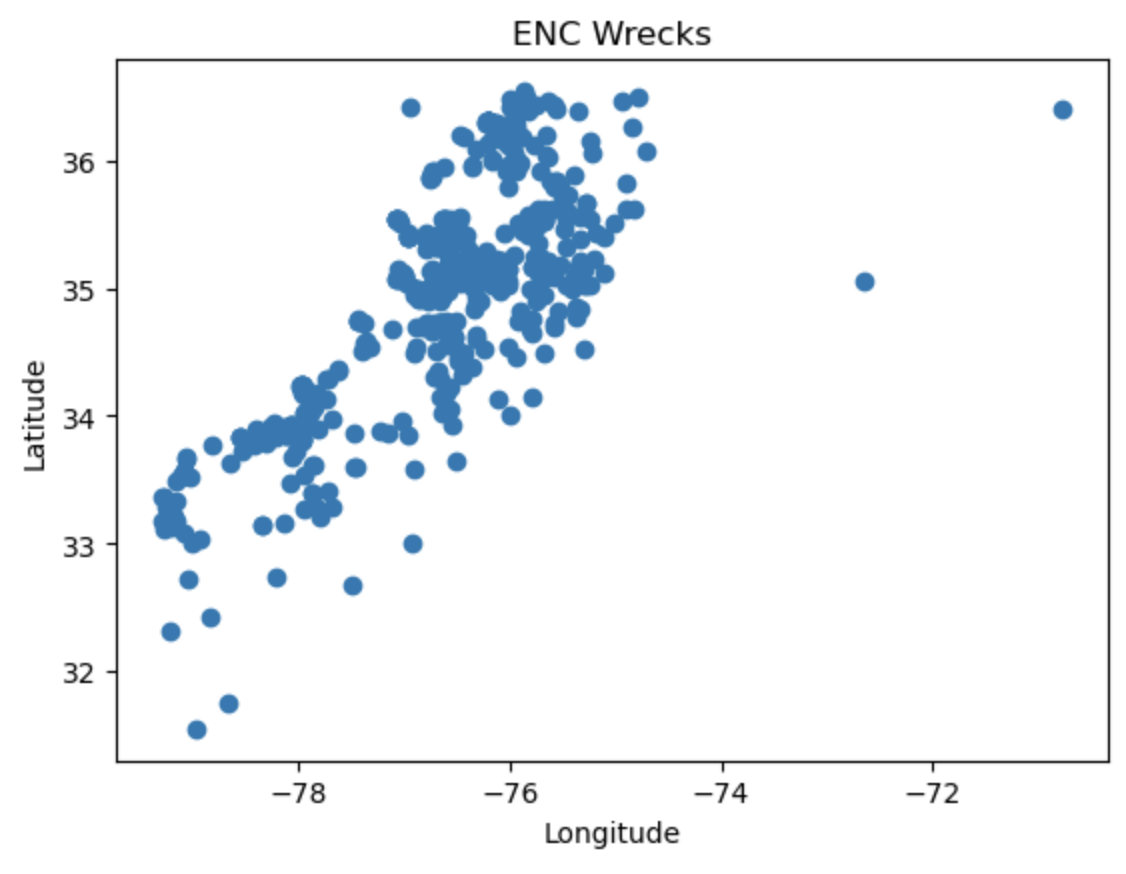
The geodataframe shows our georeferenced locations as well as any potential size and other information about the object. In the following scatter plot are the locations of various wrecks in our region of interest. Our bounding box coordinates run along our x and y axes. It can be a little difficult to gain perspective when seeing these dots without a map in the background, which is why we also created that folium map.
Artificial Reefs and Oyster Sanctuaries
The North Carolina Division of Marine Fisheries maintains 43 ocean artificial reefs and 25 estuarine reefs. These reefs help promote ecological balance and provide homes for many wild and farmed animals. The materials for these reefs range from sunken vessels and concrete pipes to concrete structures and reef balls- little habitats designed to act as an artificial reef (North Carolina Department of Environmental Quality). We brought this point data into our project as a KML.
A Reef Ball provides habitat for dozens of types of marine life:
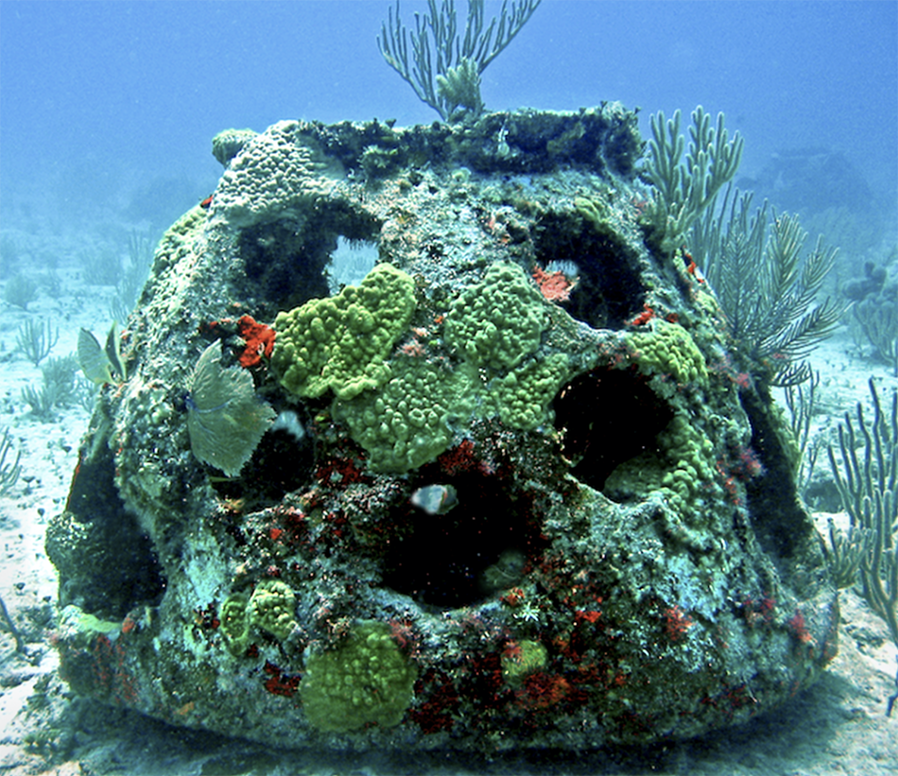
image credit: Wikipedia commons
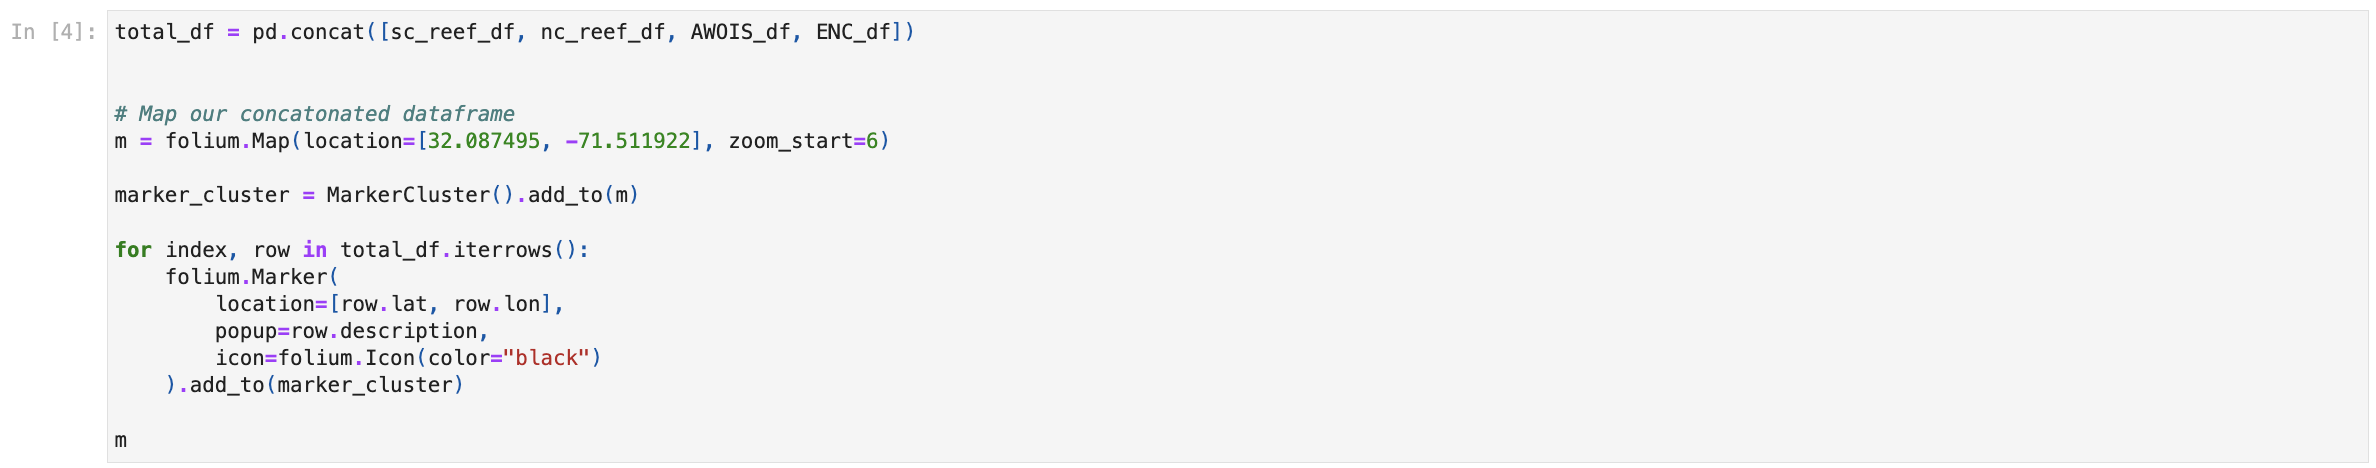
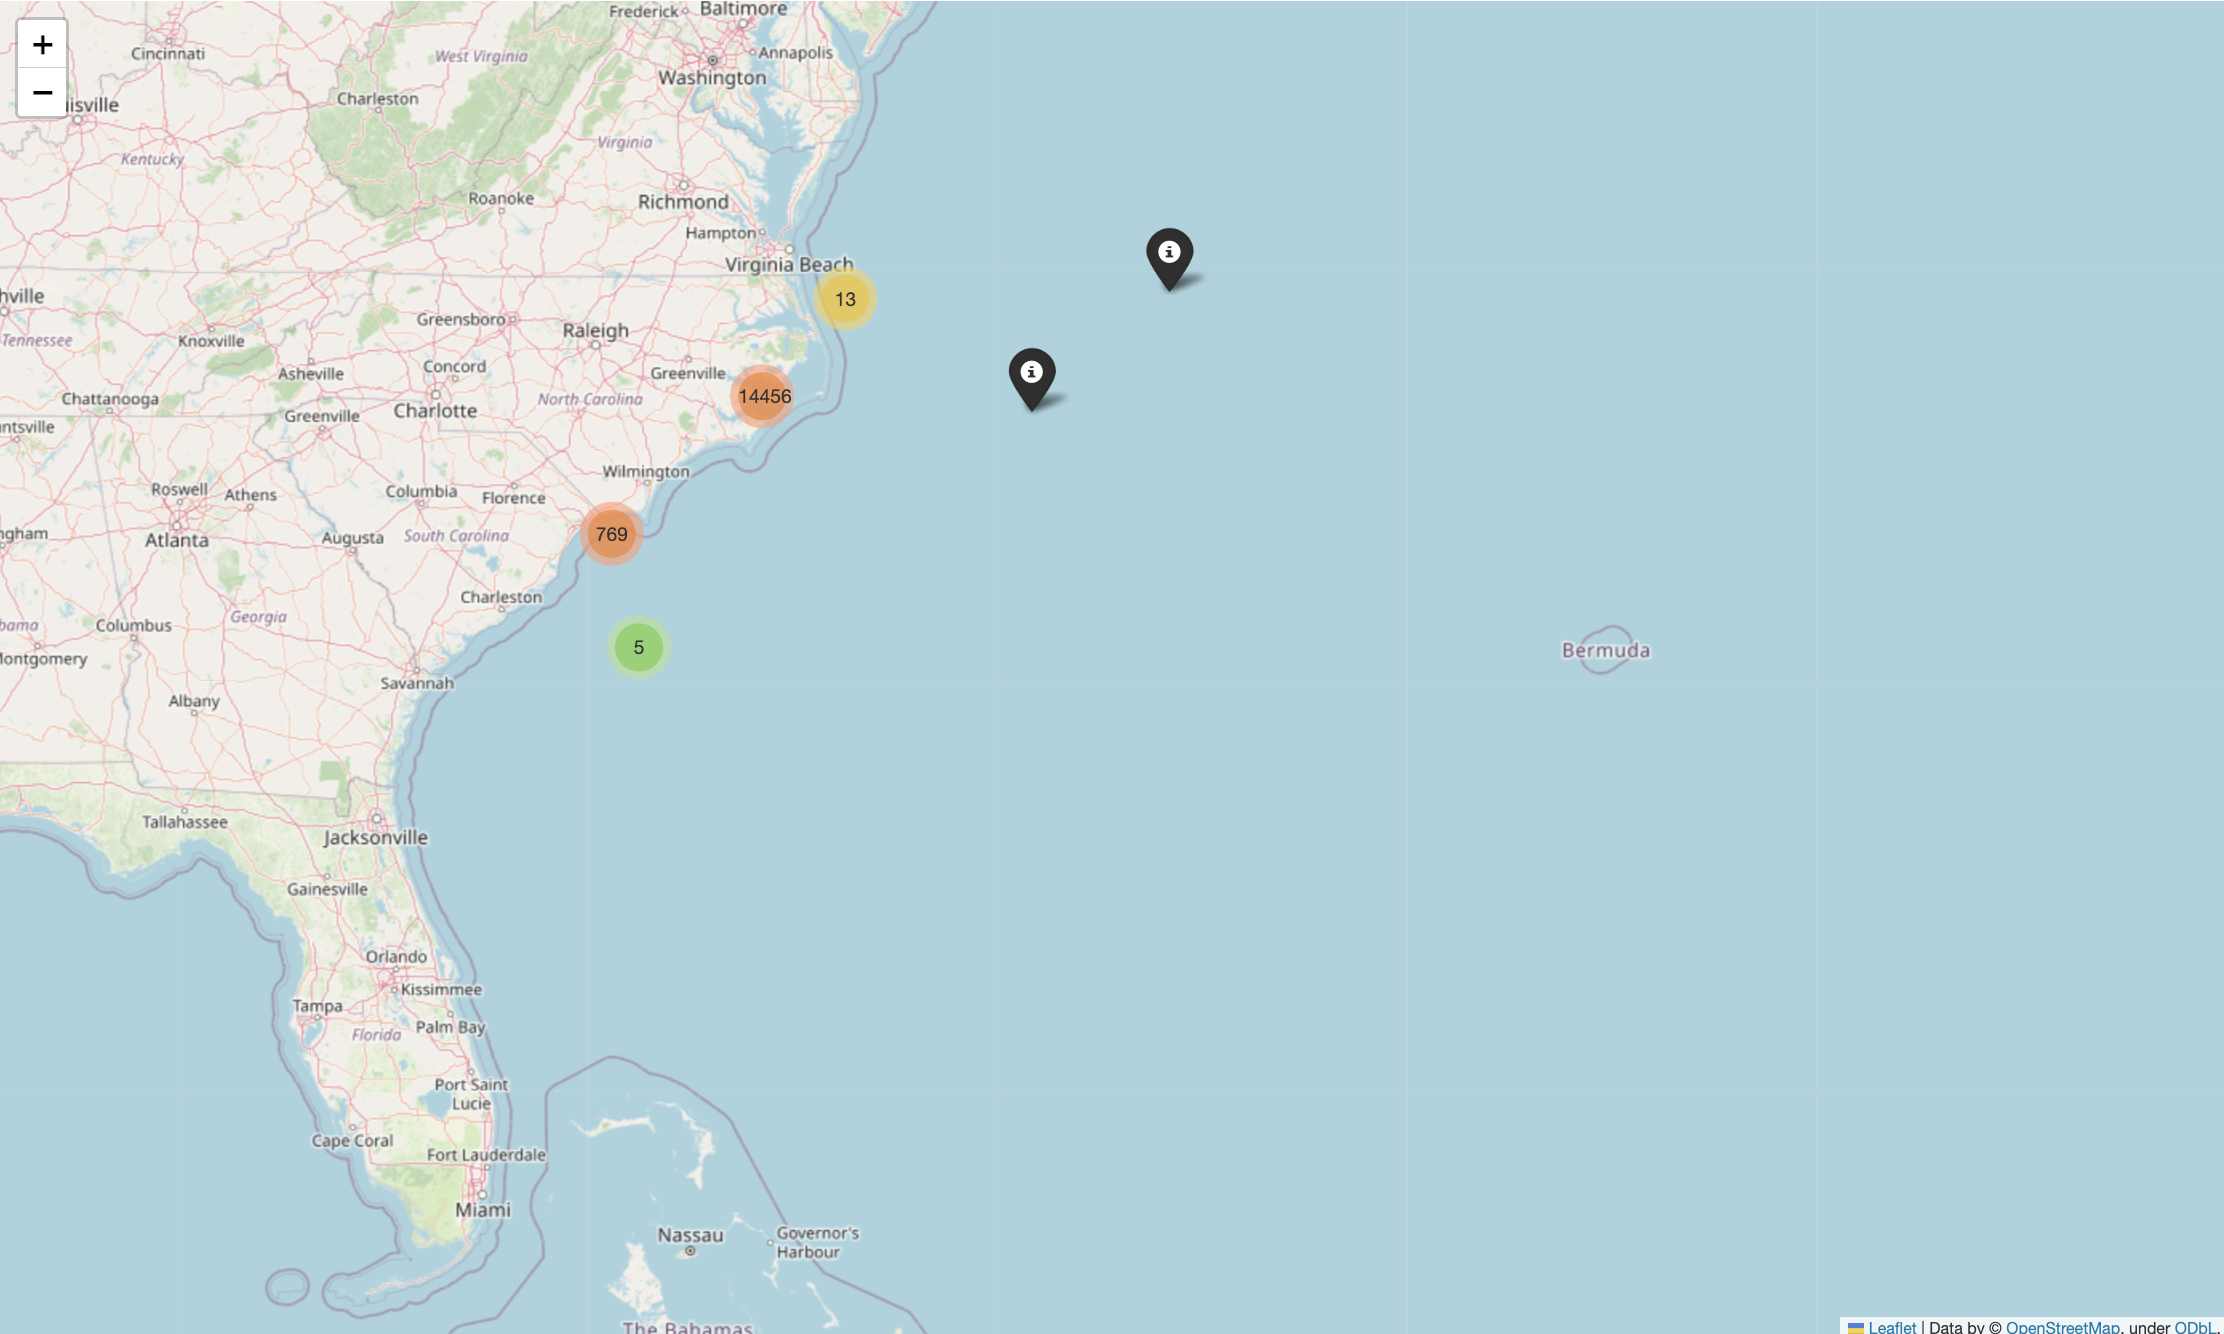
The map below shows point data for the artificial reefs, confirmed wrecks from electric nautical charts, as well as wrecks and obstructions from the AWOIS database in our area of interest. The interactive quality of this map allows the user to zoom in further and further on clusters of objects until identifying information about the point displays. This data is what we can use to see how our inferential data such as currents and sediment are impacting physical ts.
Bathymetry & Waves
Bathymetry is the study of the measurements of depth of water on ocean floors. One can think of it as underwater, 3-D cartography. This study gives us information about depth and terrain and is very useful for producing nautical charts (oceanservice.noaa.gov). Understanding the currents and the strength of the waves- and therefore impact on the objects below- helps our model interpret activity in the ocean's depths. While all of our data until now has been point data, this is more continuous data. Our bathymetric data is open-sourced government terrain data. It 1-km resolution land surface digital elevation model from USGS.
Below is an example bathymetric map. They resemble heat maps.
Marine Mishaps
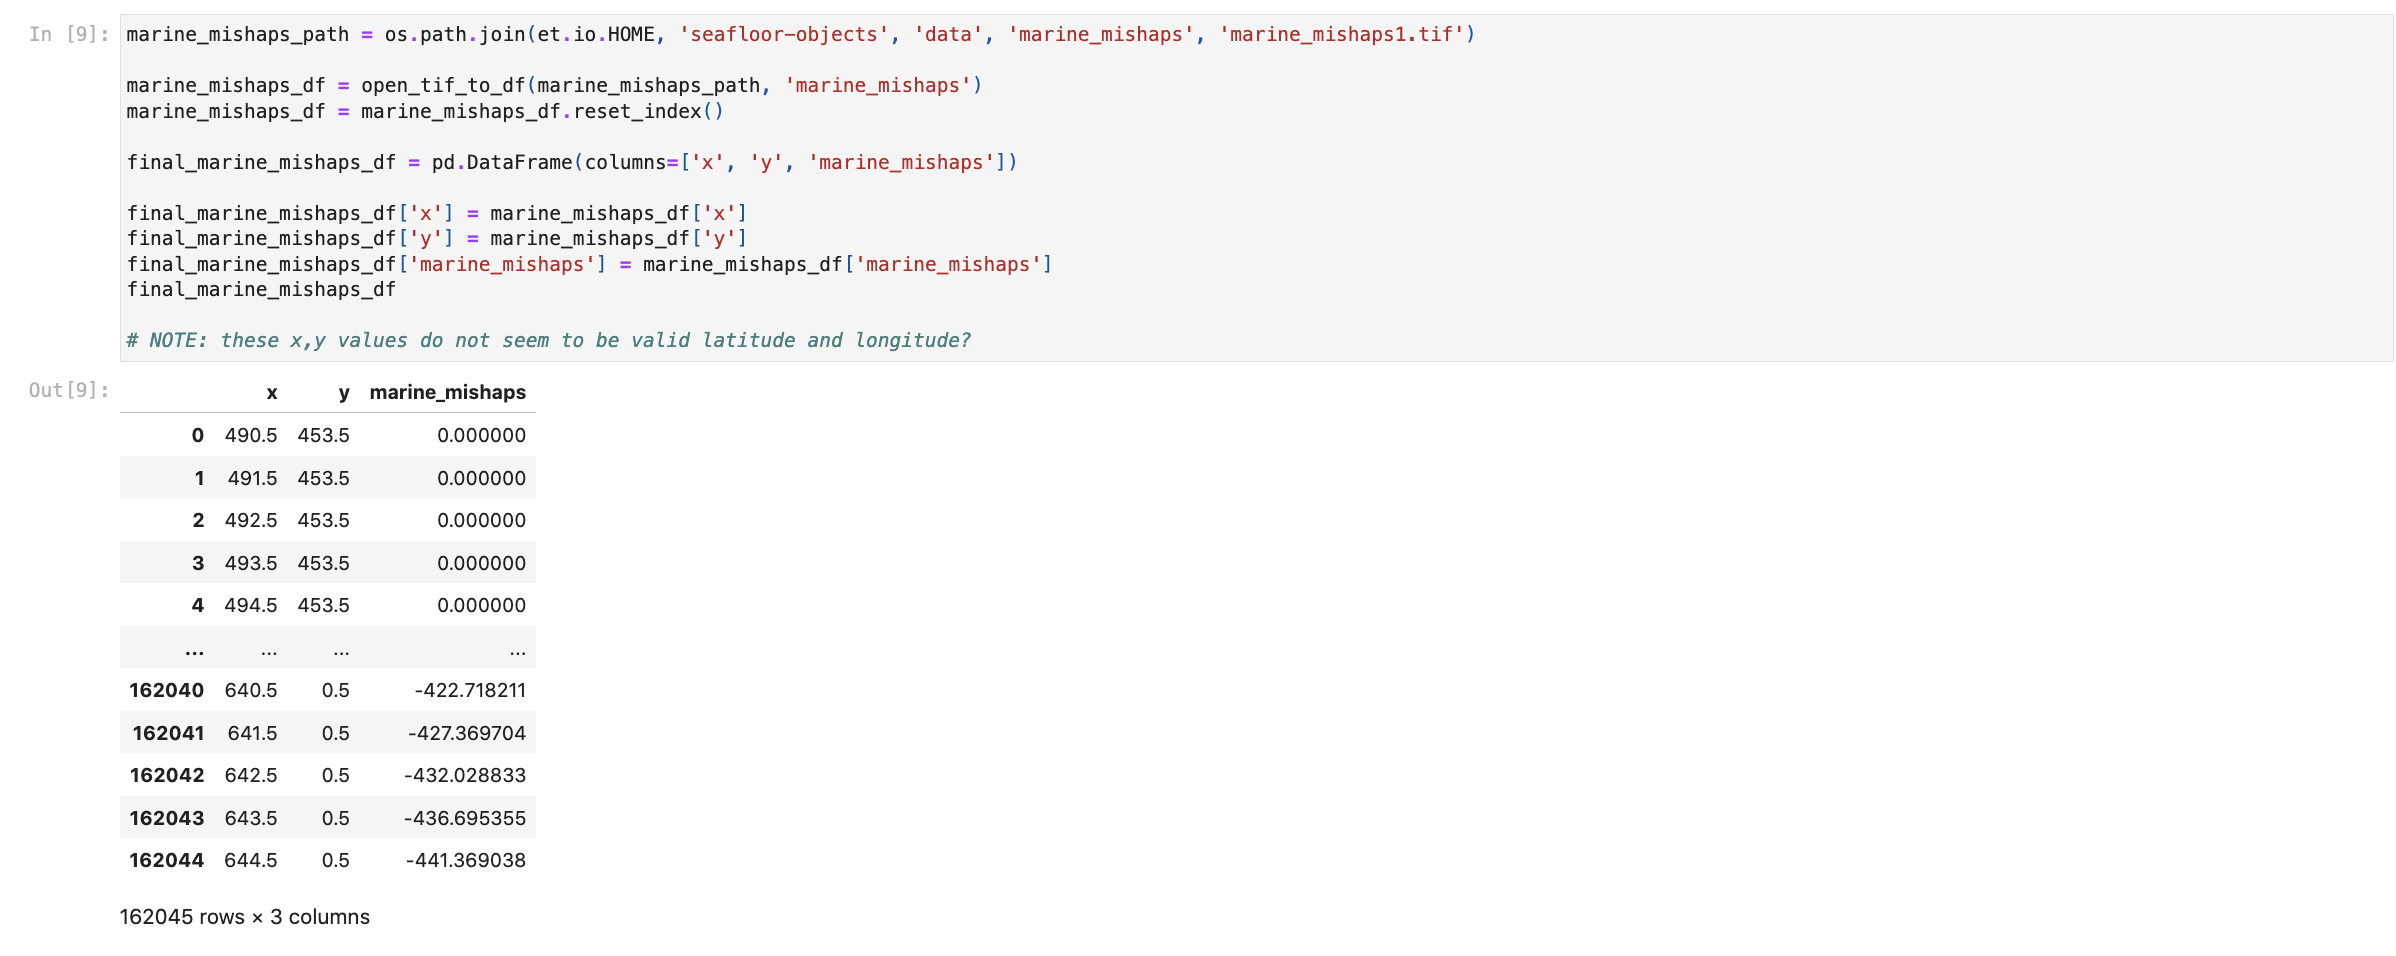
This data part of the MISLE (Marine Information for Safety and Law Enforcement) database and is maintained by the United State Coast Guard and covers the broad realm of marine accidental and deliberate pollution, marine casualties, as well as a host of other types of shipping and port accidents within United State's waters (USGC, US Coast Guard Marine Safety Management System (MSMS), 2008 (now MISLE). This database helps catch wreck that the AWOIS/ENC databases might not have.
When we brought in the marine_mishaps data we realized that it was gridded data and not conformed to lat/long like our other datasets. Below you can notice that the x and y values on the dataframe are clearly not latitude and longitude. This is something we have no experience with and were therefore not able to use it in our training data frame; we simply didn't have the time to figure out how to translate that style into coordinates. This was a lesson to us about how sometimes data just doesn't work with a project or other data sets.
Nightlights Fishing Lights
"Nightlights" is data that is being closely tracked by scientists in various marine fields around the world right now. This data helps us track where shipping vessels are and especially helps us when they go "dark"- that is when they go off-radar. Many illegal dumping and fishing fleets have been caught with this type of data. This data is captured by the Suomi National Polar-orbiting Partnership satellite which carries an extremely sensitive camera, the Visible Infrared Imaging Radiometer Suite (VIIRS), which images the entire earth’s surface every night (Global Fishing Watch, 2023).
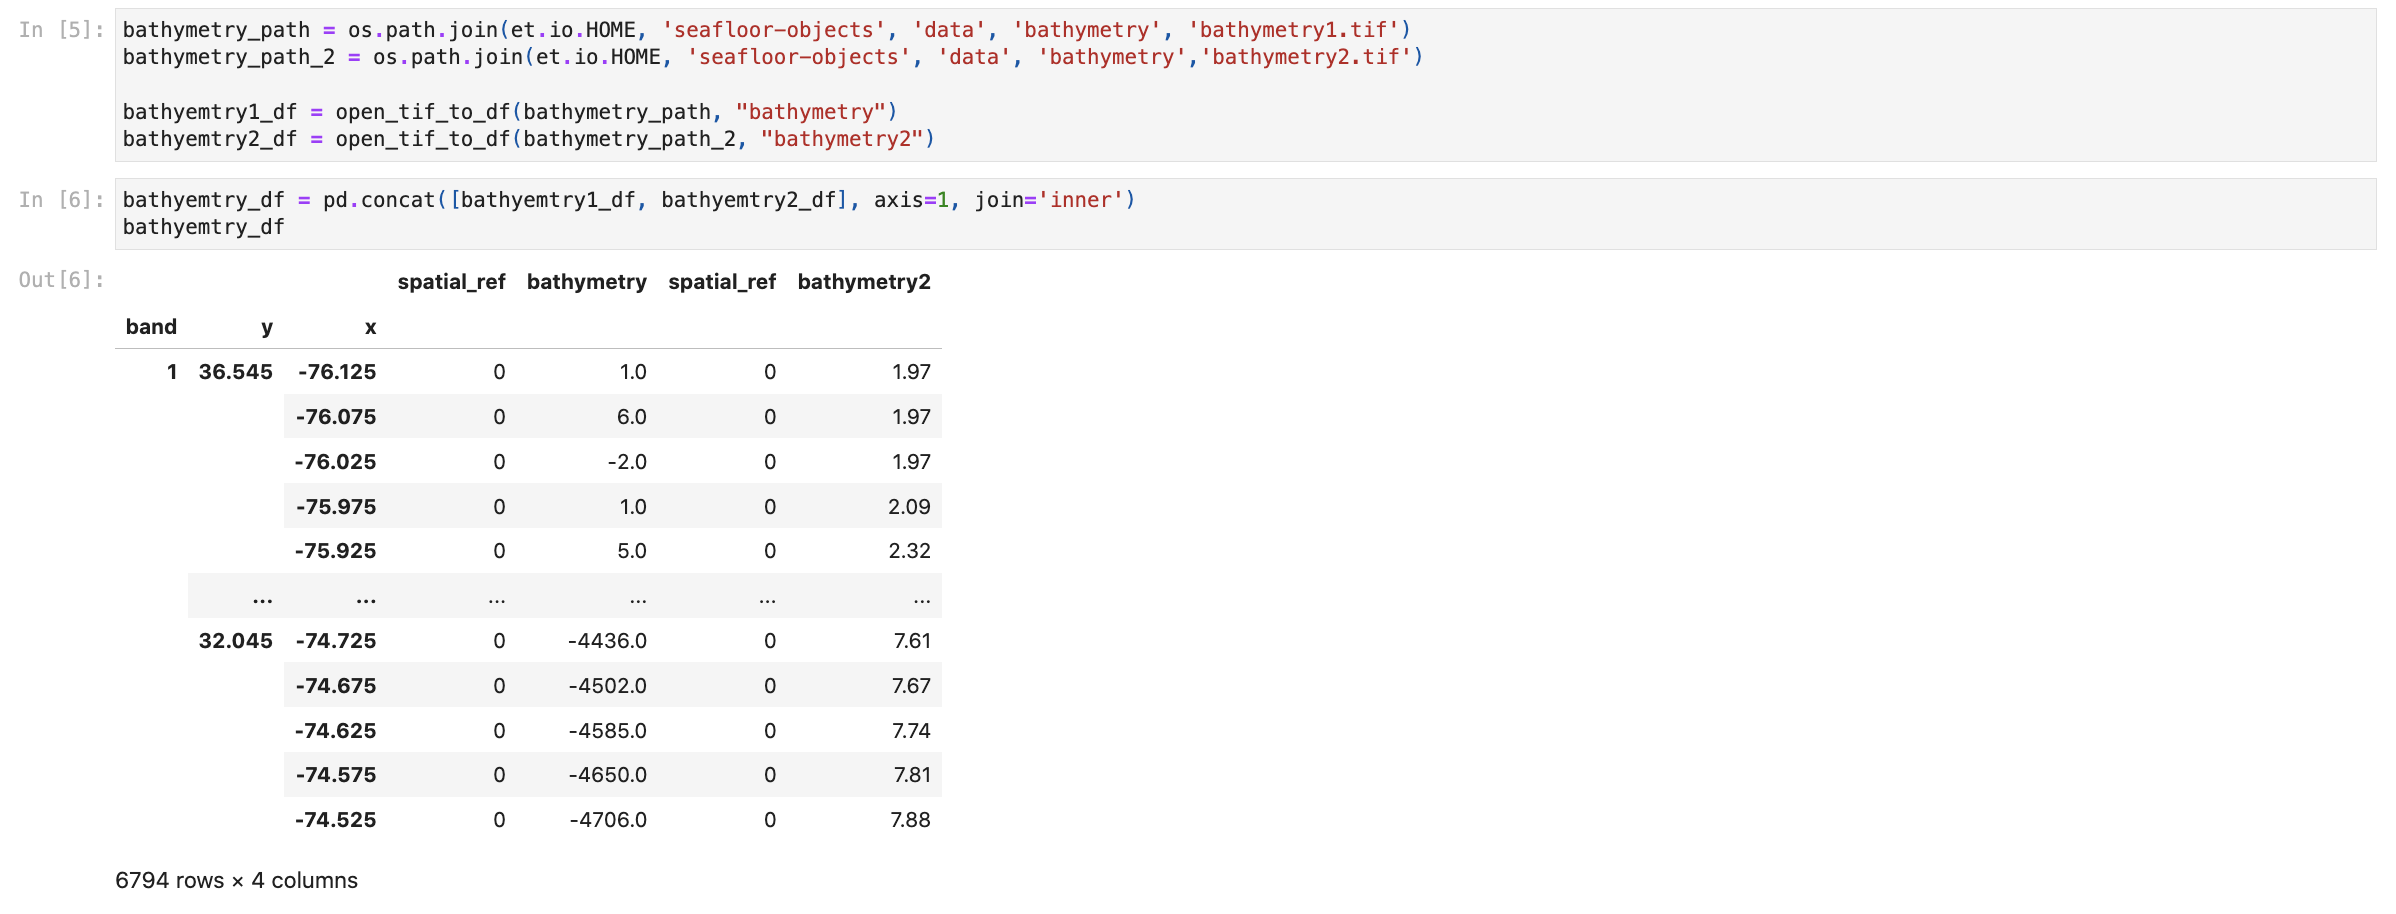
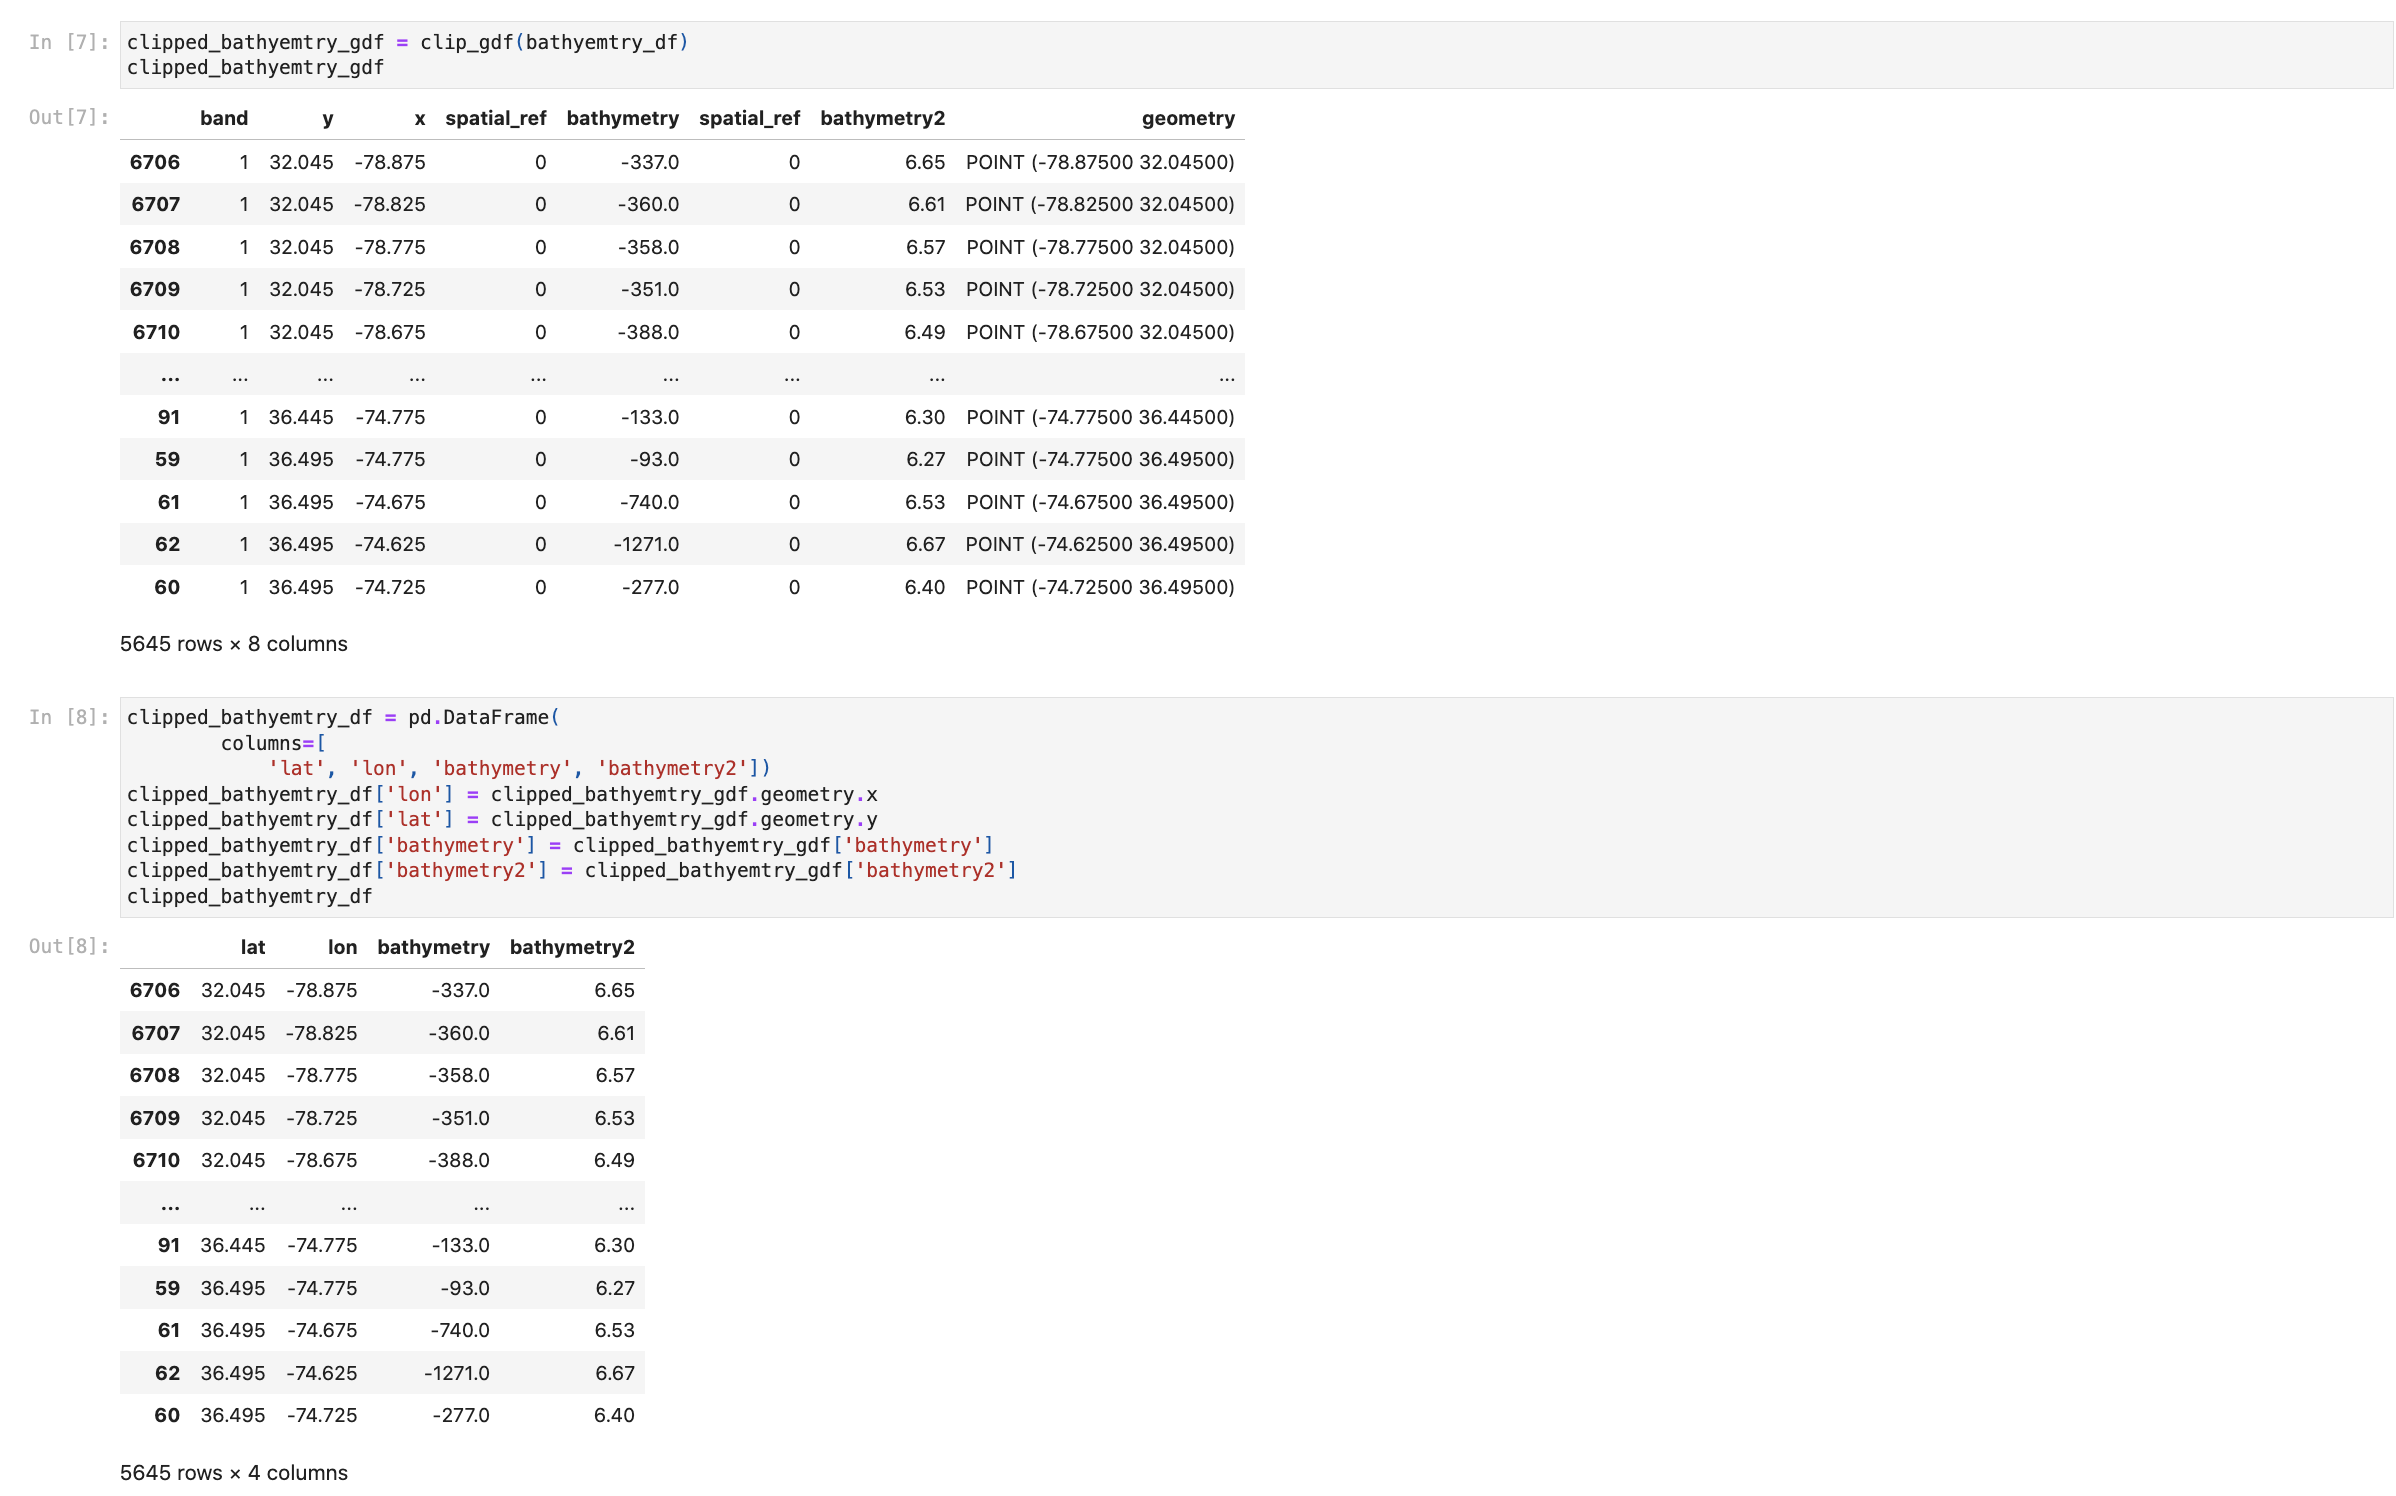
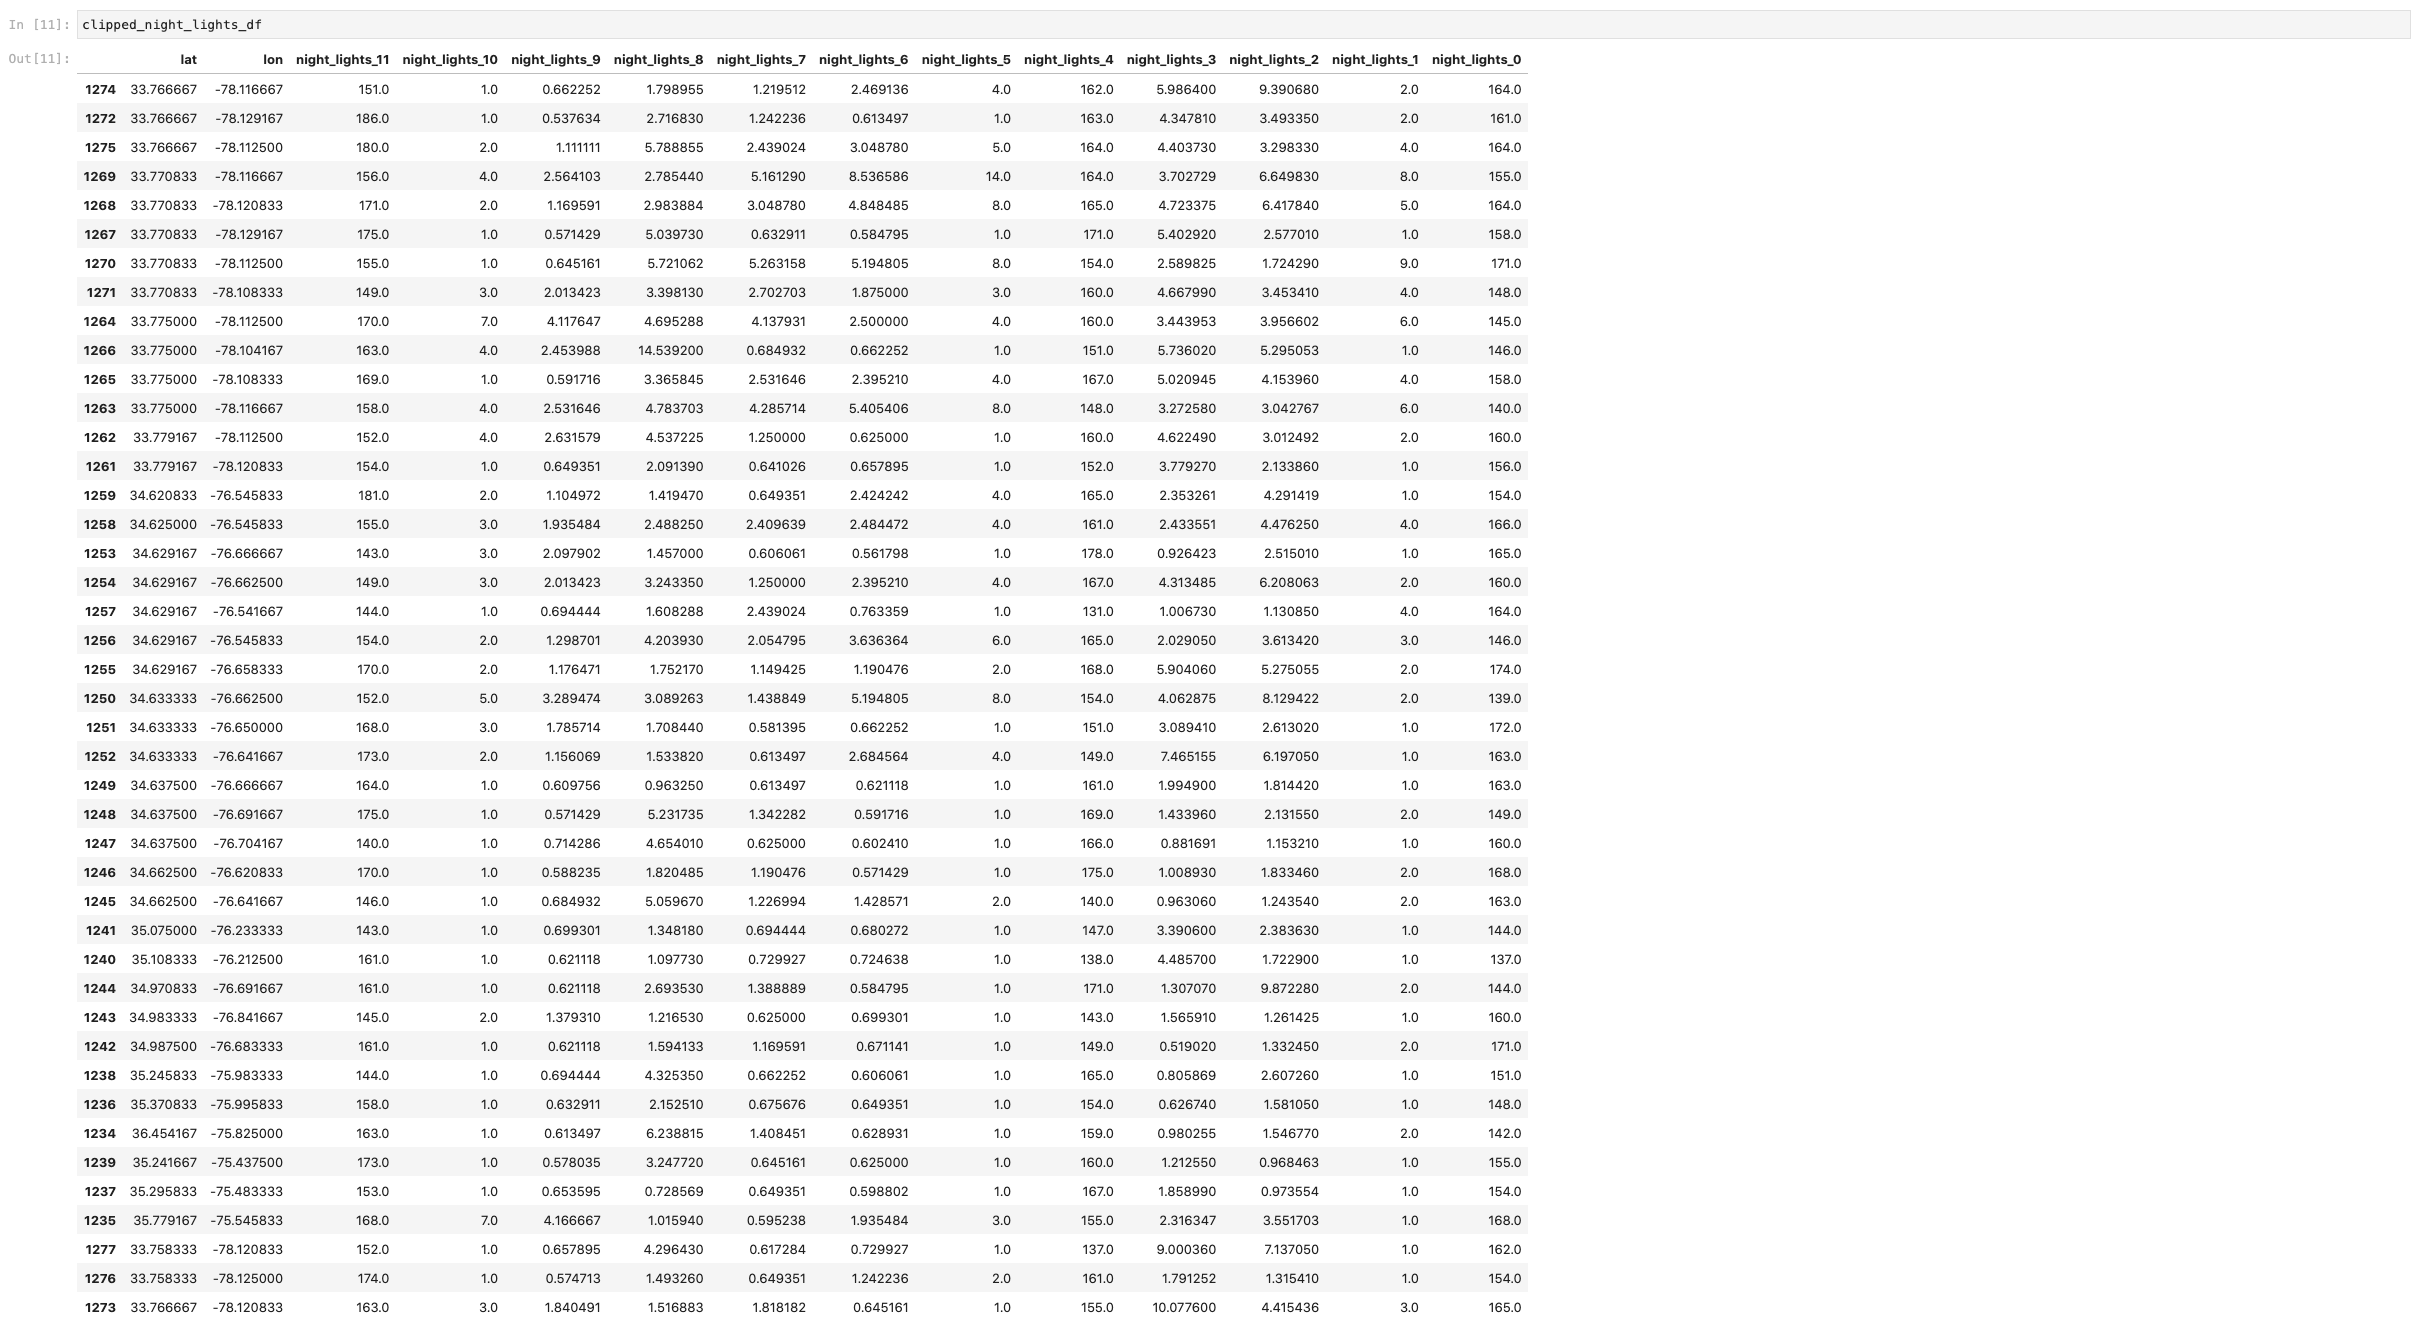
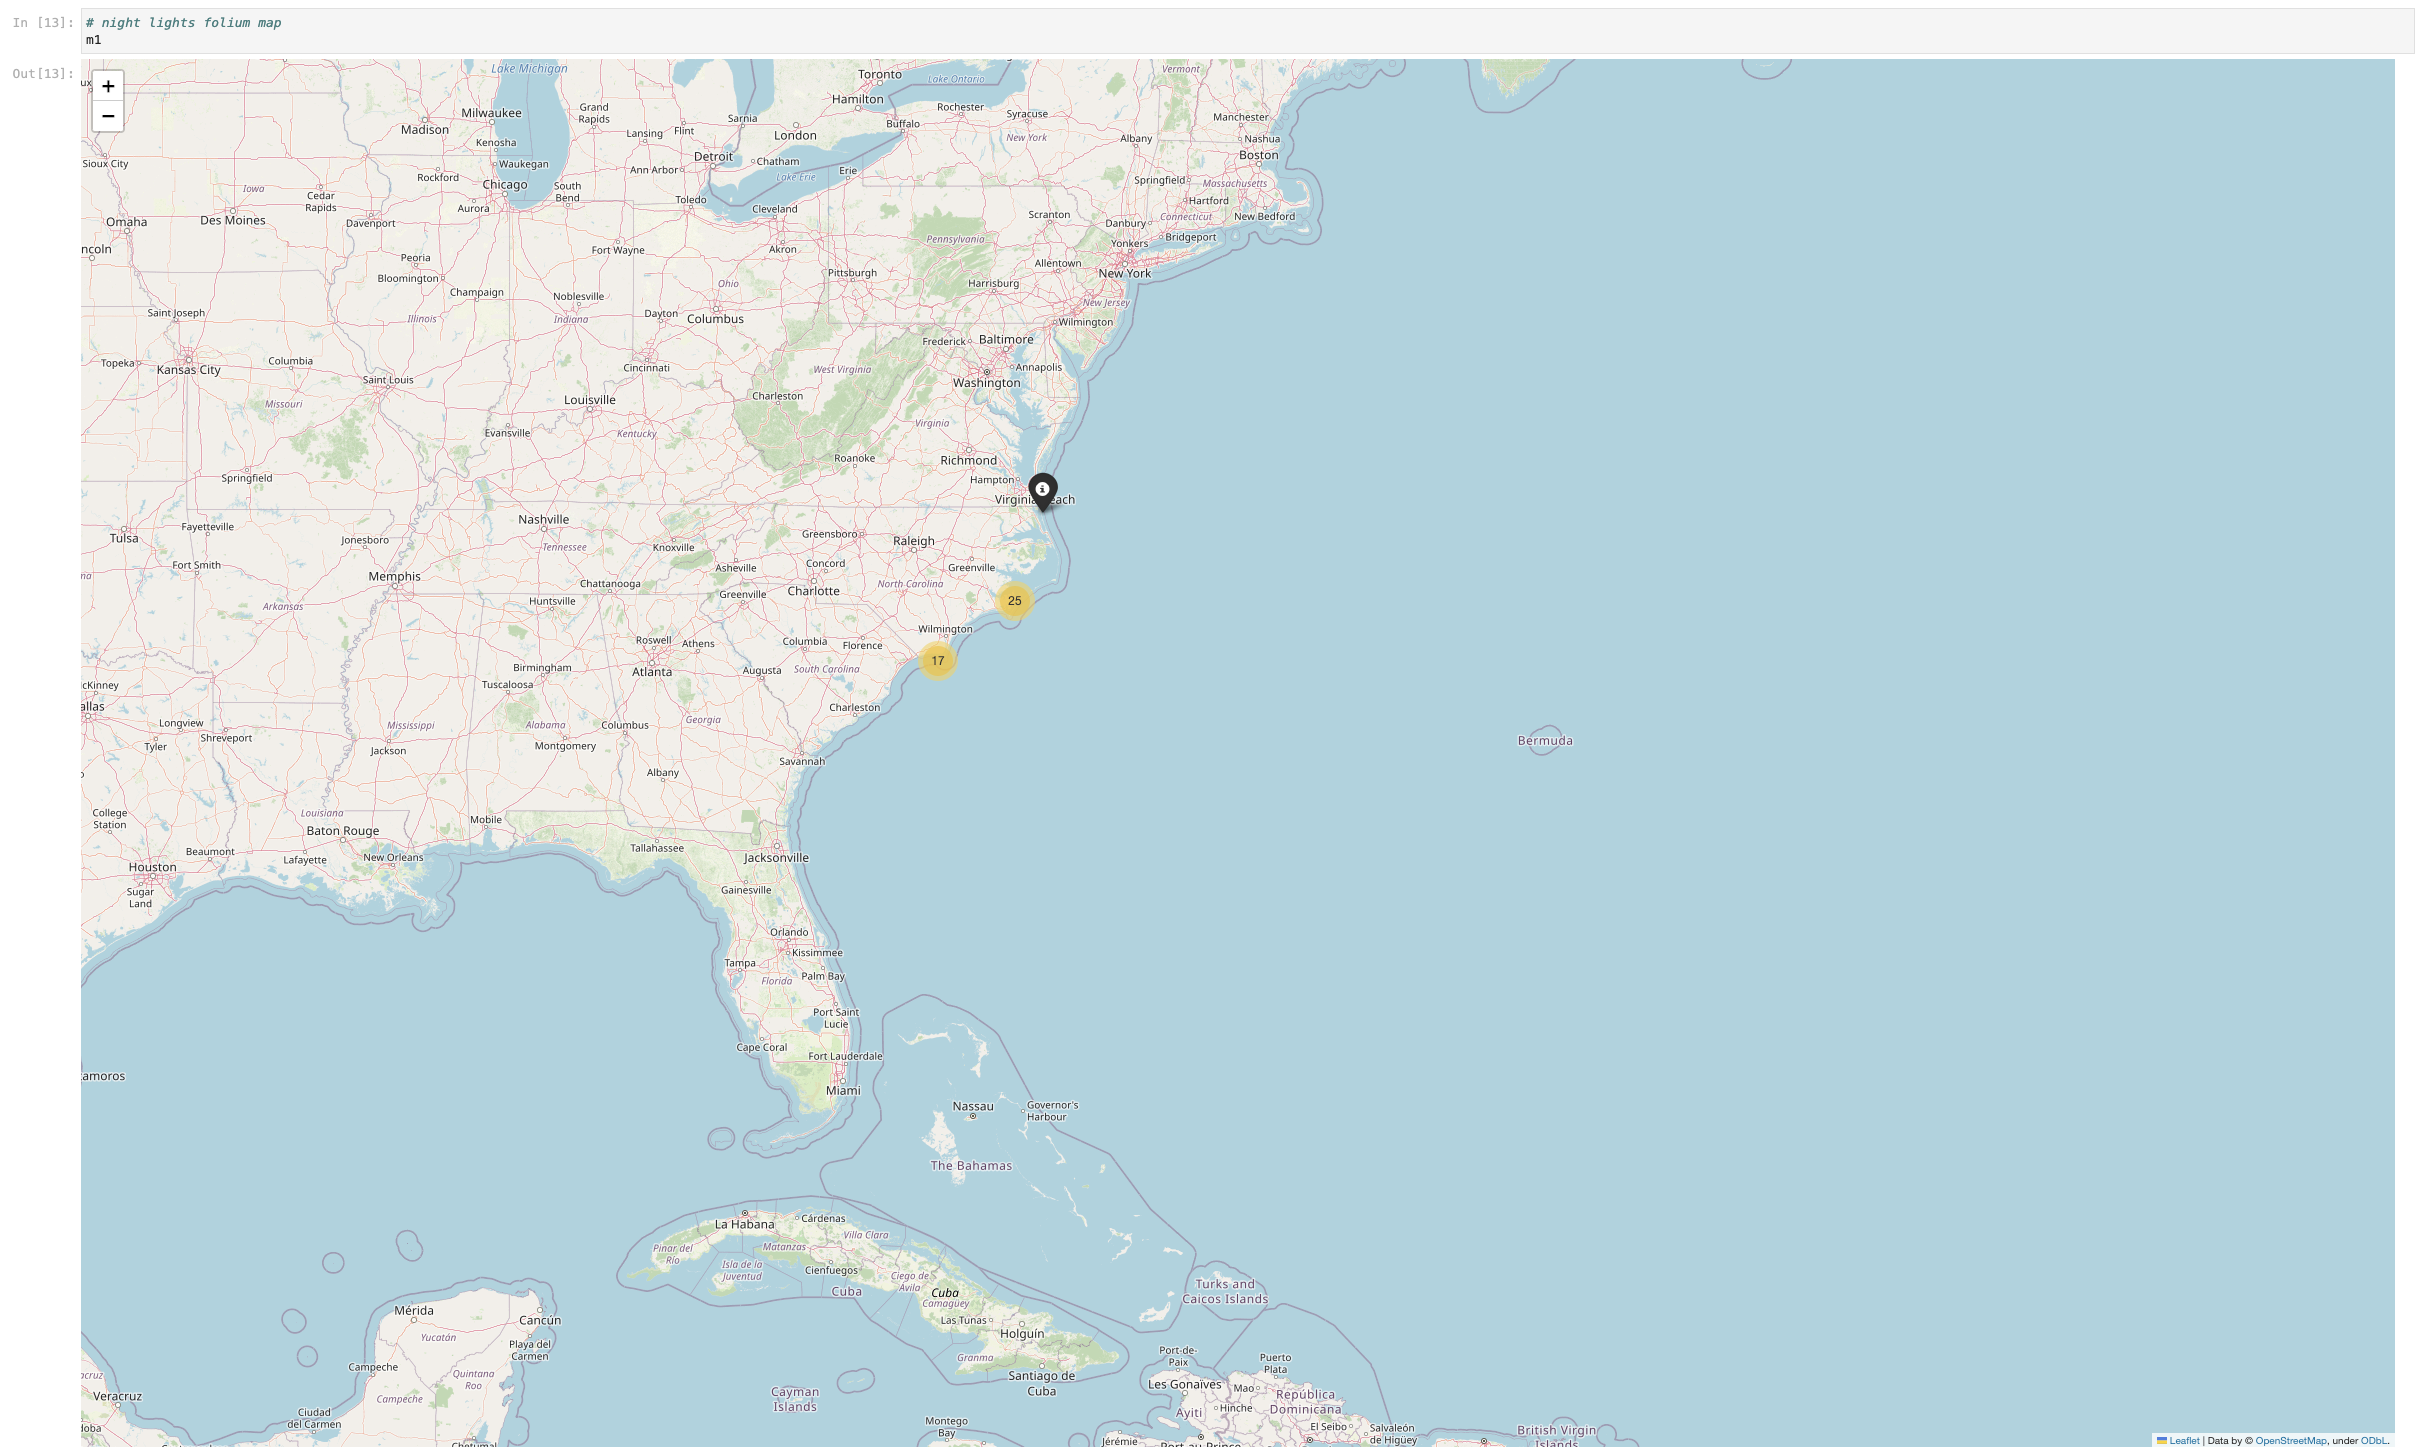
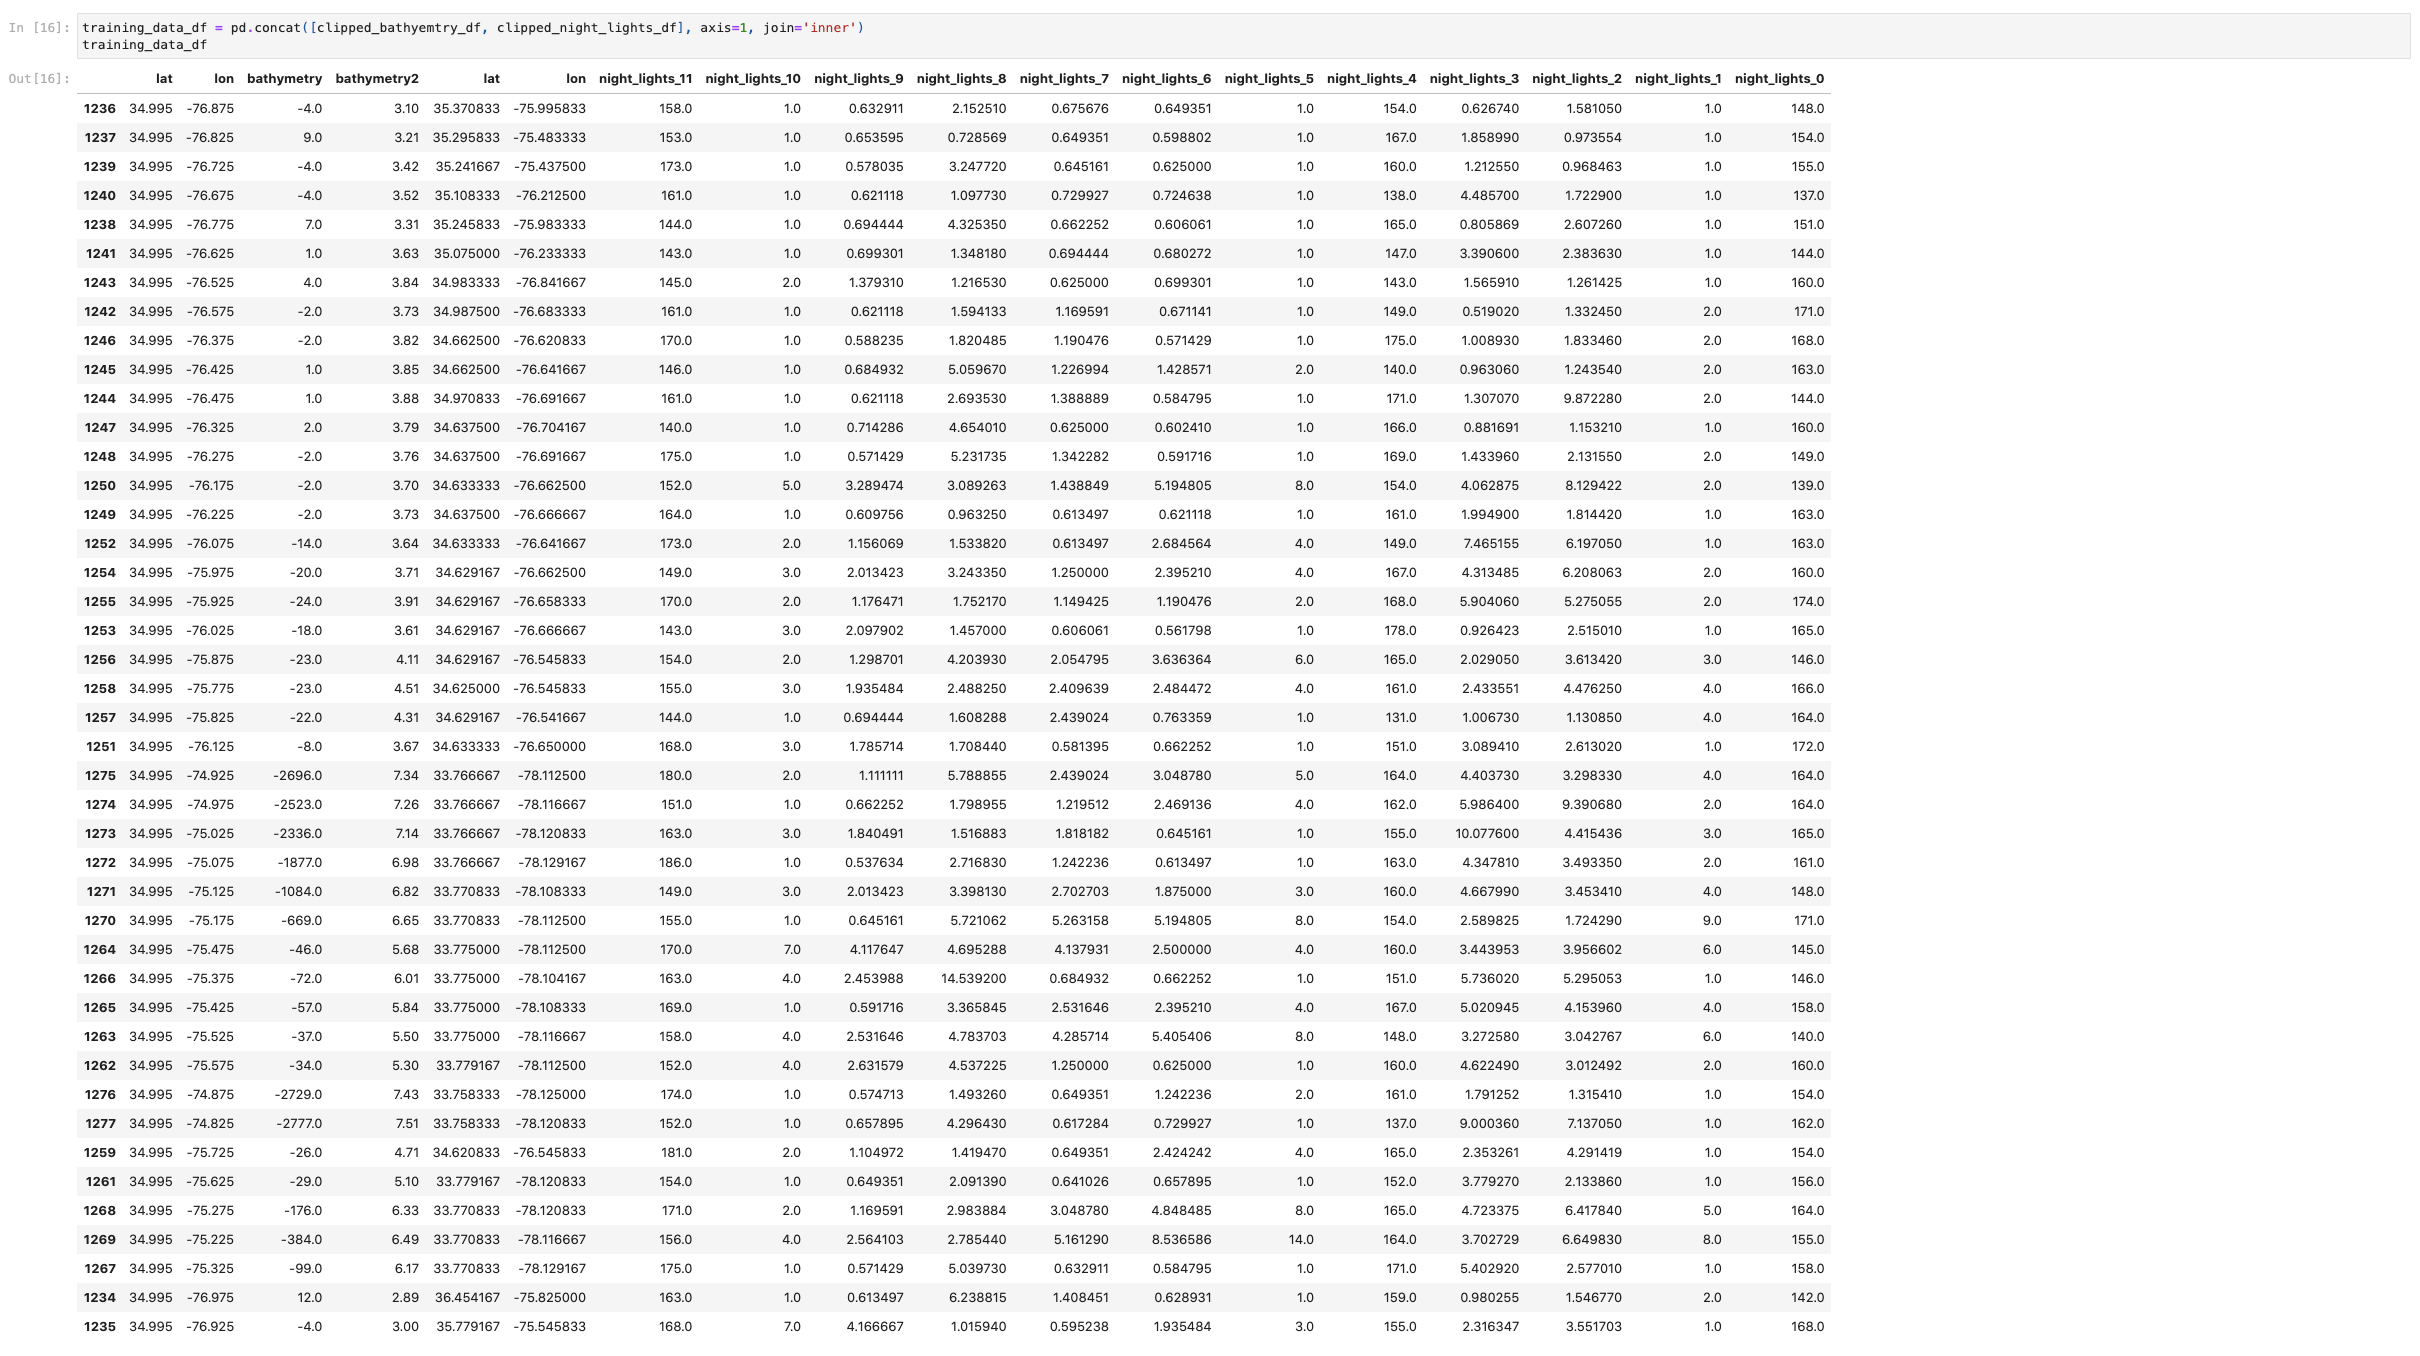
We have a large range of Night Light data frames that we were successfully able to concatenate together, which helped us create a Folium map of all of the Night Lights detected in the region in our bounding box. This data set is a series of tif's that were concatenated into one large data frame with an inner join (shown below). All 11 of the initial frames are now in individual columns attached to our bounding box coordinates. From this one large nightlights data frame we were able to create an interactive map of all the vessels that are traversing the area after dark.
Some of these these tifs when converted to datrames had ~17,518,801 lines. Once we dropped NA values, did the inner join, and clipped to our bounding box we were left with only 43 lines.
Currents & Waves/dbSEABED Data:
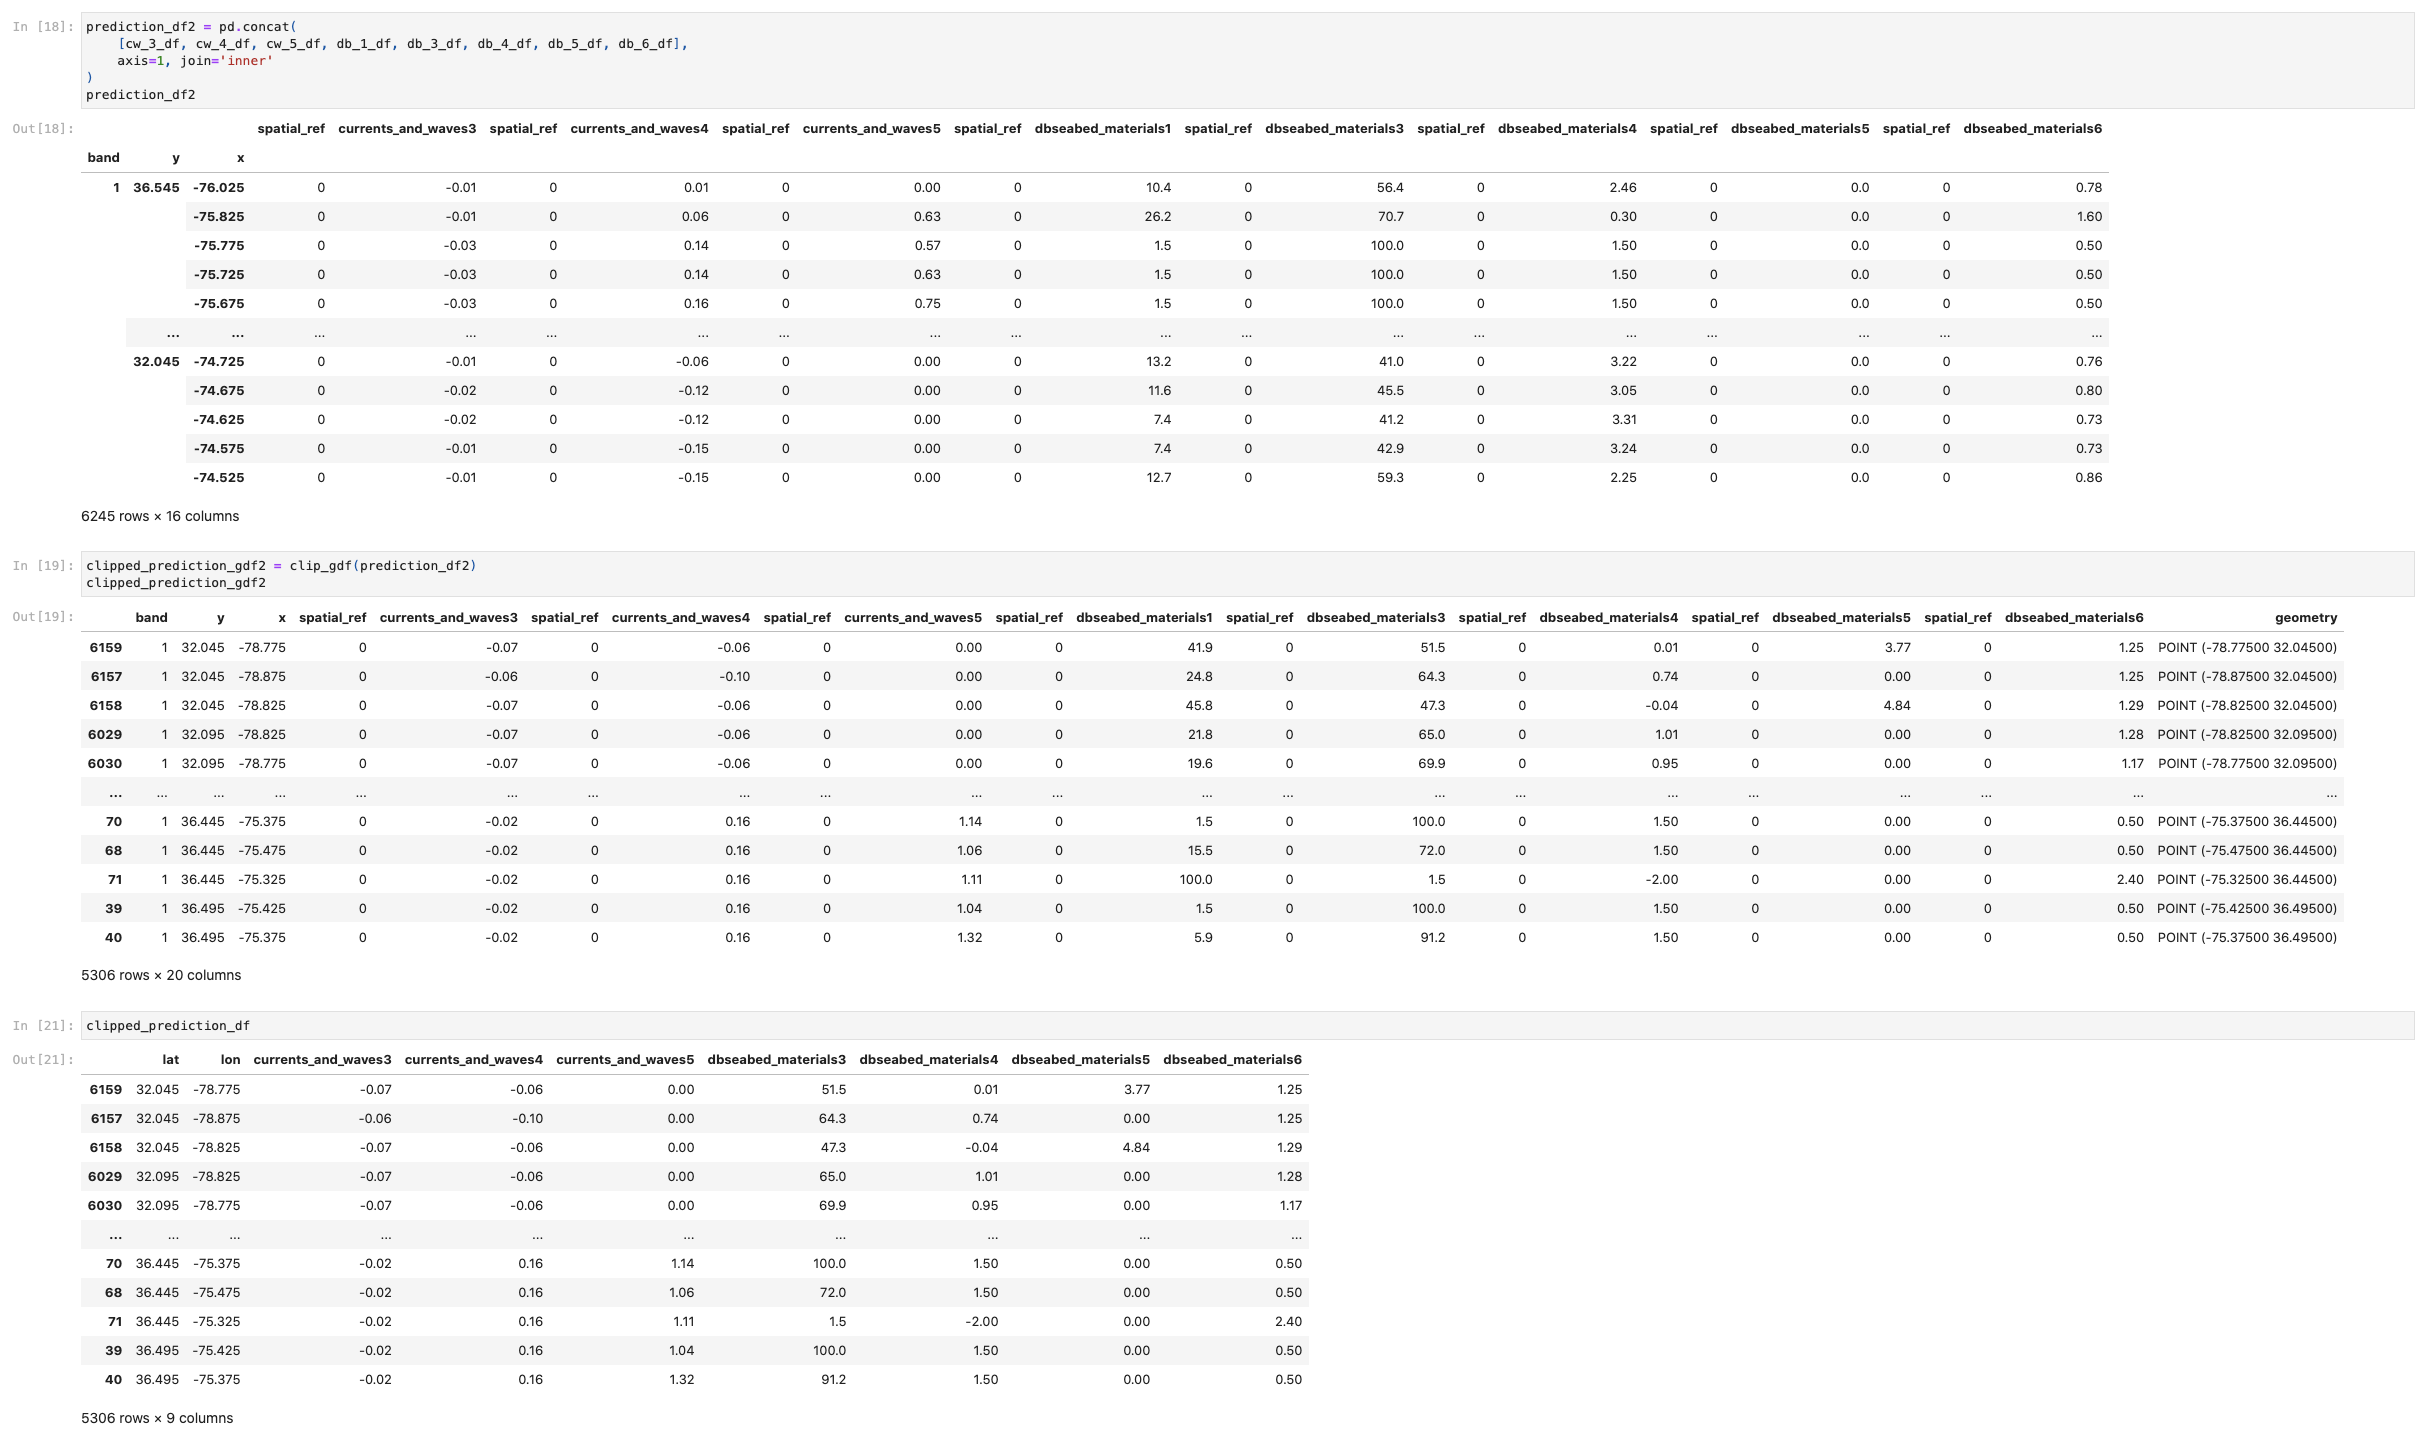
Both of these datasets are supplied by INSTAAR, a CU Boulder-based collaborative. They aim to combine a large range of seabed data to provide ocean-bottom information. The dbSEABED data system contains data about seabed texture, composition, acoustic properties, color, geology, and biology (Instaar.colorado.edu, 2007). Data from them can be pointwise, rasterized (cell-wise), formatted as ESRI grids, or Geotiffs. This collective aims to provide easy-to-access KML versions of their data that can be easily viewed on Google Earth (their download links are currently not active). This data would act as our prediction data in a machine learning model, which means that it is data that would be provided to the model. That model is trained by our other joined data frame which is comprised of all the other data above. This data frame is known as the training data.
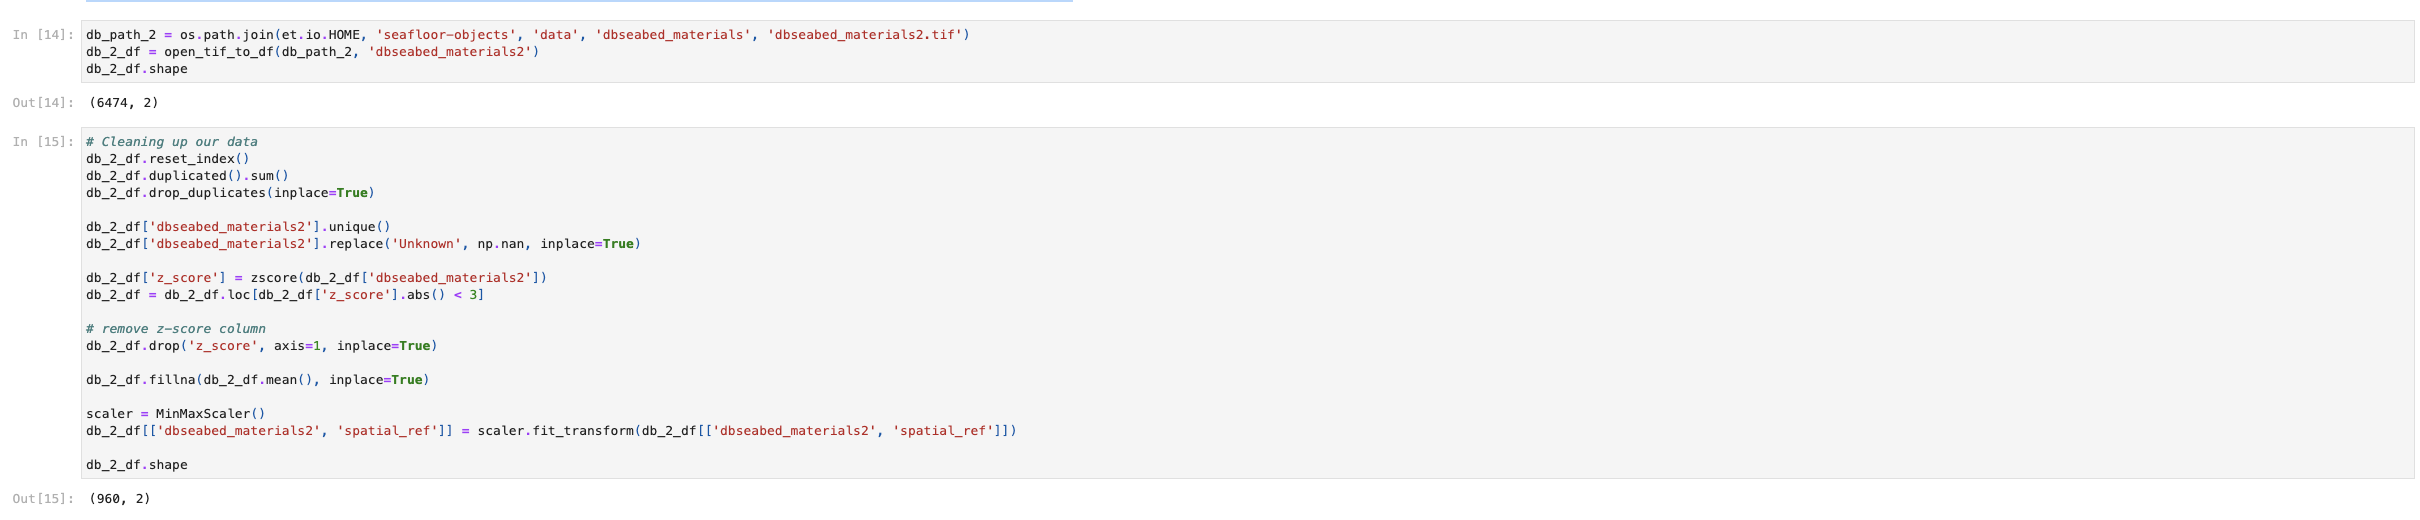
Below we have an example of cleaning data and some methods that may help clean up a data set to make imachine-learning-readyd In this example, we are using the dbSEABED data.y. The ocess of cleaning data is complex and there is no one fits all approach as every data set is different, but these are some great steps. We reset the index first to make sure we have a defined index, then we drop any duplicate entries and fill in na values. We also produce a z-score for each value that is relative to the mean and standard deviation of the dataset. We also show some scaling with the MinMaxScaler(), a function from sci-kit that helps prepare data for sci-kit learn models. This scales data to a fixed range. In this dataset, it is not terribly important because it is one set, but once data sets have been merged this is a very useful tool.
Notice in the first cell below that the length of the frame is almost 6500 lines. After performing some data cleaning our shape gets cut down to 960 rows.
Combining our Data
We were able to successfully concatenate some of our training data, as well as most of our prediction data into large training and prediction data frames where each dataset is referenced by one corresponding coordinate value. The final dimensions of the training and prediction data frames were (43, 18) and (662, 10) respectively. These datasets need to be the same size to be used in machine learning and these sets are off. Furthermore, our nightlights data became so small when removing nan values that the datasets do not seem like they would contain enough corresponding information to receive a useful value from our model.
NearestNeighbor
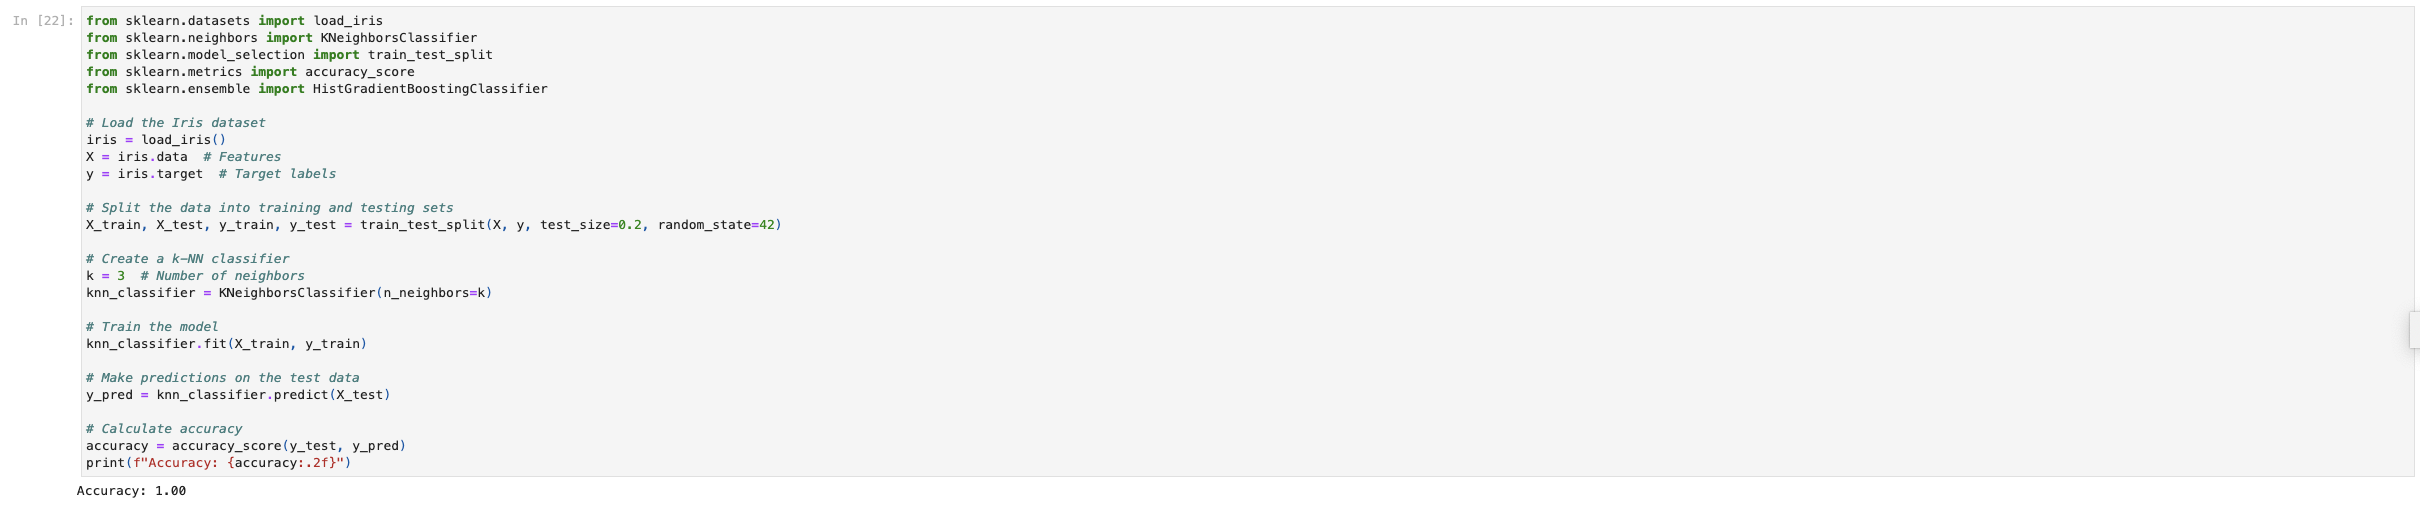
Once data is conformed, two large sets of data are merged to perform machine learning on. One set of data trains the model, the other set is what we look for correlation in. These are known as the "training data" and "testing data." The NearestNeighbor Analysis from ScikitLearn is a great starter machine learning model for this situation because this analysis measures the spread or distribution of something over a geographical space. We were not able to use our datasets for this task but we ran an example. Below is a sample code for a machine learning model from sci-kit Learn. This is data pre-wrangled and available through sci-kit learn to perform practice machine learning models on.
X_train and X_test refer to our training data that the model will use to learn from. y_train and y_test refer to the prediction data that corresponds to the aforementioned 'X' data. When these 2 interact the predicted values (y) are compared against the trained values, 'X.' We picked an average-sized 'k.' k os a parameter that represents the number of neighbors to consider when making predictions. A smaller 'k' may be sensitive to noise, while a larger 'k' can lead to bias. Once we run the algorithm we can predict accuracy and see that in this dataset the accuracy is 1.0. This means that the model achieved perfect classification on the test data. This is great, but a score like this in a real-data setting may be too good to be true and may raise cause for suspicion. It may indicate data issues. We would expect our data to have a significantly lower accuracy score.
Docker
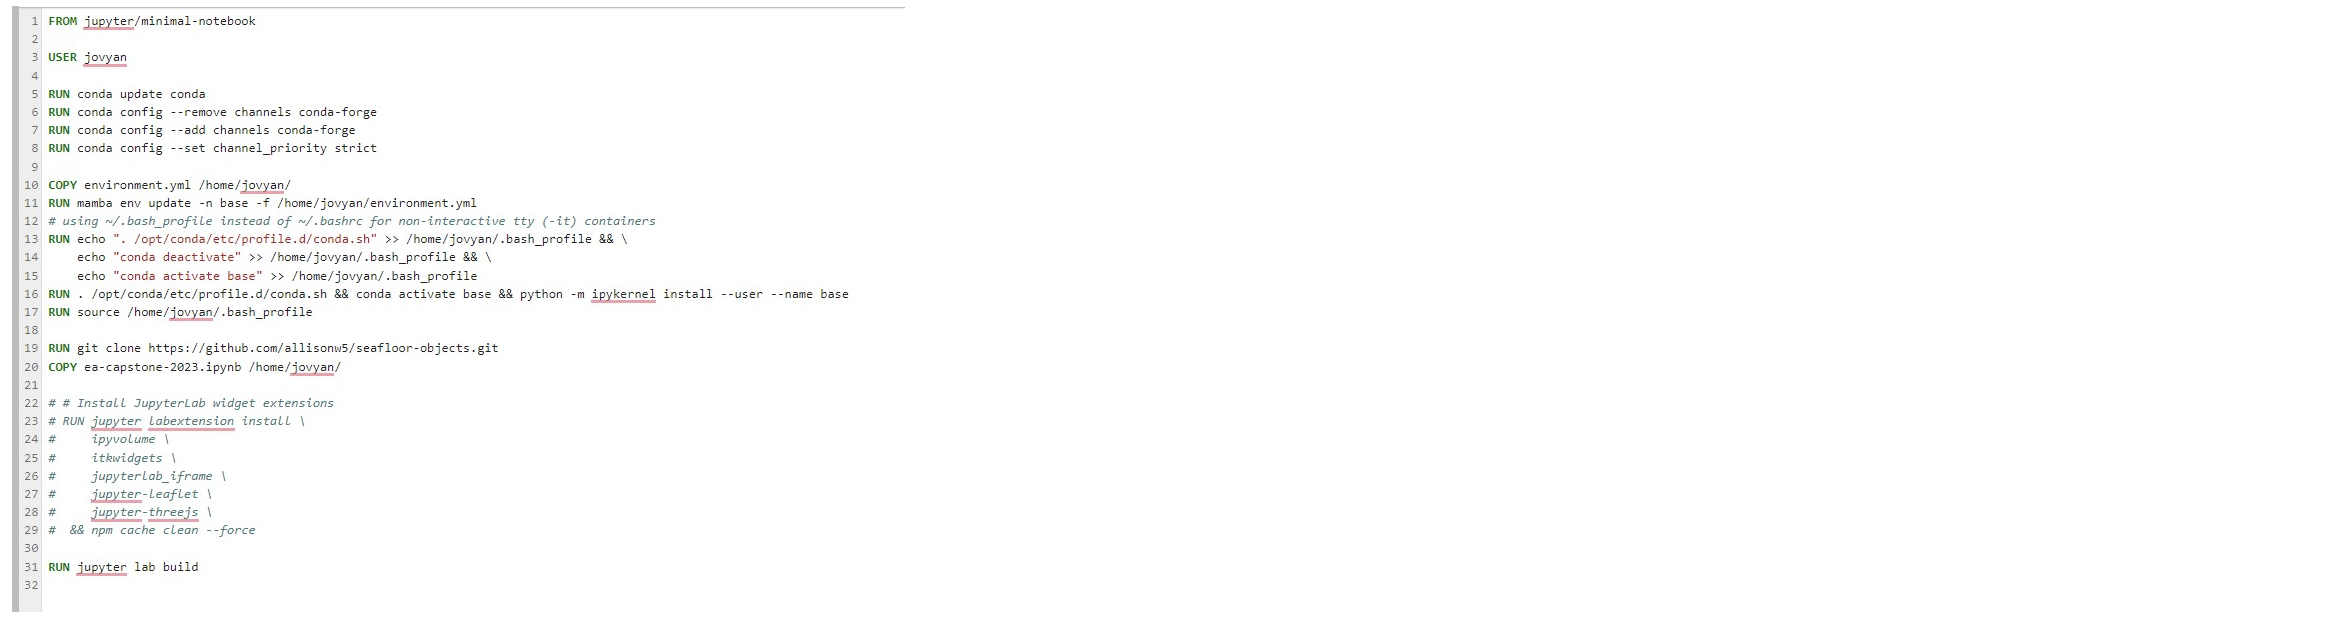
One of the first issues we encountered during this project was hardware issues. One of the computers we were using could not solve the environment (one of us works on Mac, the other on Windows) and so we had to build a docker container. Docker is a lightweight, standalone software package that includes everything needed to essentially act as a virtual computer. An initial image is built that contains environment details and then a container is run from it. Docker provides a consistent and reliable way to run applications across different environments and is very popular for software testing and development. This meant we had to learn the ins and outs of troubleshooting that platform, which added a layer of complexity to our project.
Once we had all of our data imported into our notebook, we began to have memory issues. We have so much different data that concatenating them takes a huge amount of memory and caused issues with the docker container. It became very difficult to run the notebook all the way through and it took quite a bit of constant finesse to keep the computer and container running.
Below is an image of our Docker image commands.
Final Thoughts
The ocean is a massively important place for us as a planet. Due to its size and depth, tracking what happens on the seafloor has traditionally been very hard. Having cutting-edge methods such as the Nearest Neighbor model will help us to develop environmental models that can aid in sustainable fishing practices, enhance our navigational safety, help us understand climate change impacts, and so much more. Just last year a report came out that stated that a glacier machine learning model- the Instructed Glacier Model- was developed to predict the evolution of glaciers and ice sheets up to 1000 times faster than any previous methods (Columbia Climate School, 2022). This extreme increase in speed is due to the fact that the heavy physics that is involved in modeling is handled by AI and therefore can be processed much faster. This model will greatly enhance our ability to predict sea level rise and is only one of many examples of how this type of technology may positively impact our society.
Our particular project was wrought with problems and had many frustrations attached to it. We learned the hard way near the end of the term that we had made very lofty goals and would not be able to complete our initial mission: to employ a machine-learning model that analyzes what may happen to sunken objects. We had so many varying data sets and so much complex data cleaning and manipulation to do. Our project really became a lesson on how to download and manipulate various types of data frames. This summer was a fascinating and frustrating delve into cloud-based computing, data wrangling, machine learning, and ocean floor investigation. It wasn't how we saw our project going, but disappointment aside, it is all too often what happens in science. To quote an American hero and famed scientist Thomas Edison, "I haven't failed, I've found 10,000 ways that don't work."
Want to learn more?
Please visit our git hub repository for more technical information and to view our software:
https://github.com/rmarowitz/seafloor-objects
You may also contact us at:
allisonwiddecombe@gmail.com or
Robyn.Marowitz@colorado.edu
Thank you for your interest!
Citations
Ardhuin, Fabrice & Herbers, T & Vledder, Gerbrant & Watts, Kristen & Jensen, R. & Graber, Hans. (2015). Slanting-Fetch-JPO-2007-Ardhuin-etal.pdf.
Becker, J.J., D.T. Sandwell, W.H.F. Smith, J. Braud, B. Binder, J. Depner, D. Fabre, J. Factor, S. Ingalls, S.-H. Kim, R. Ladner, K. Marks, S. Nelson, A. Pharaoh, R. Trimmer, J. Von Rosenberg, G. Wallace, and P. Weatherall (2009) Global Bathymetry and Elevation Data at 30 Arc Seconds Resolution: SRTM30_PLUS, Marine Geodesy, 32:4, 355-371, http://dx.doi.org/10.1080/01490410903297766.
Byrum, J., & Hendrix, N. (n.d.). Artificial Reefs. North Carolina Environmental Quality. Retrieved April 18, 2023, from https://www.deq.nc.gov/about/divisions/marine-fisheries/public-information-and-education/coastal-fishing-information/artificial-reefs
Coz, J. (n.d.). Artificial Reefs - Data Files. Retrieved April 29, 2023, from https://www.dnr.sc.gov/marine/reef/
"Learn about Ocean Dumping," epa.gov. October 27, 2022.
"Machine Learning Techniques Can Speed Up Glacier Modeling By A Thousand Times," Glacierhub Blog, Columbia Climate School. March 25, 2022.
National Oceanic and Atmospheric Administration (n.d.). Wrecks and Obstructions Database. U.S. Office of Coast Survey. Retrieved April 21, 2023, from https://nauticalcharts.noaa.gov/data/wrecks-and-obstructions.html
Night Lights data was shared with us from the Colorado School of Mines and processed by the Earth Observation Group, Payne Institue for Public Policy:
Hsu, F.C., Elvidge, C.D., Baugh, K., Zhizhin, M., Ghosh, T., Kroodsma, D., Susanto, A., Budy, W., Riyanto, M., Nurzeha, R. and Sudarja, Y., 2019. Cross-matching VIIRS boat detections with vessel monitoring system tracks in Indonesia. Remote Sensing, 11(9), p.995.
Elvidge, C.D., Ghosh, T., Baugh, K., Zhizhin, M., Hsu, F.C., Katada, N.S., Penalosa, W. and Hung, B.Q., 2018. Rating the effectiveness of fishery closures with visible infrared imaging radiometer suite boat detection data. Frontiers in Marine Science, 5, p.132.
Elvidge, C.D., Zhizhin, M., Baugh, K. and Hsu, F.C., 2015. Automatic boat identification system for VIIRS low light imaging data. Remote sensing, 7(3), pp.3020-3036.