Flooding on Tribal Lands
By Bri Stone, Shana Larwrence, Jesse Joseph
A Common Issue
Spring of 2019 Tribal Nations in South Dakota suffered from extreme flooding that resulted in road loss, land degradation, and property damage. Most reservations do not have funding or resources to replace or rebuild. In the case of road loss, sometimes that road may be the only route causing the possibility of communities or families to be isolated from resources. Property damage for farmers and ranchers can take years to recover, sometimes resulting in total loss.
Creating a reservation wide map that contains high to low risk levels will help the tribe identify areas to design preventative measures rather than reacting to the situation. Additionally, landowners can see what parts of their property are at risk, allowing them to use different mitigation strategies.
These reasons indicate why it is important for our team to create a universal code that results in a flooding risk map for utilization by all Tribal Entities. We hope the risk map created by the code will help to minimize the issues of land erosion, road and land loss, property damage, land degradation and loss of sacred sites within each reservation.
Prior Work
There are several organizations that have created where flood maps for most places of the United States, but their intended use is for insurance. One such organization is FEMA, who creates these maps as part of the National Flood Insurance Program (NFIP). Unfortunately when looking at the maps, the information is not very useful to the average person.
Another option was with the US Geological Survey (USGS) when they created flood maps that showed the extent of flooding for different flood severities. Although these maps are more intuitive to understand, they are also very hard to find and, in many cases, hard copies are only located in libraries of Universities. The USGS does have some very useful flood information online, but it is limited in scope.
The Method
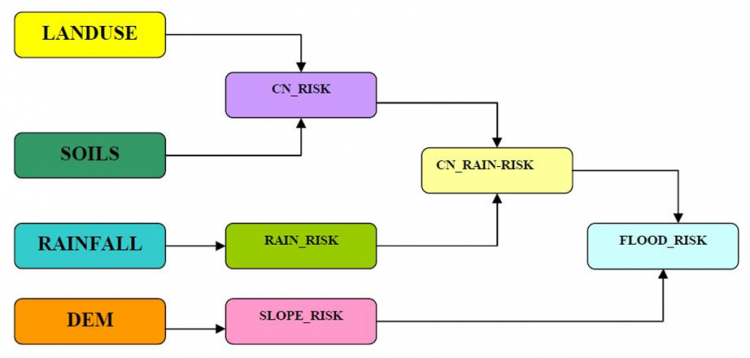
Our team derived it’s method from a similar analysis that was used to create an island wide inundation vulnerability map for the island of St. Lucia, located on the edge of the Caribbean Sea north of Venezuela. The distinctive variables (Land use, Soils, Precipitation, and a Digital Elevation Model) implemented in the document generate risk levels associated with flooding.
To determine the infiltration rate, soil type and land-use identify the Runoff Curve Numbers (CN). These numbers range from 30 to 100, with 30 being the lowest and 100 having the highest potential for runoff. Land-use categorizes CNs by soil hydrologic units (A-D) so that intersecting soil and land-use layers identify the correct CN. Using precipitation data, daily amounts for mean annual rainfall uses only data for extreme precipitation events because they result in flooding.
Finally, horizontal slopes have the capacity for pooling, thus contributing more to flooding. To compensate, slope has a risk levels of one, two, and six instead of three for horizontal gradients are. After determining risk levels of each variable, the summing of the overlapping values to identify the final risk level results in one through six being low risk and anything greater than nine being high risk.
Conclusion
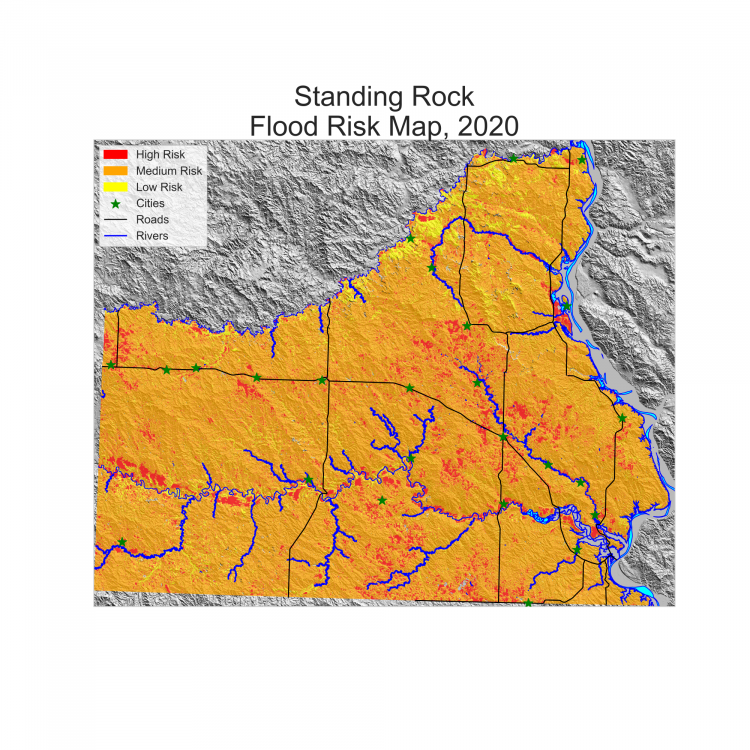
As is everyone’s goal when setting out to complete a project, not all come to fruition. In the case of our code, it is about 80% complete due to time constraints resulting in the exclusion of precipitation data. One of the big reasons why precipitation data was not included at this time is due to identifying the correct interpolation method and then implementing. Many reservations have very few rain gauges that continuously collect data. For Standing Rock Reservation in particular there are only three gauges on the reservation.
Despite precipitation’s absence, the results with just Slope, Soil, and Land-use are rather interesting. When looking at the intermediate layer of CN Risk, calculated from Soil and Land-use, it would appear that the results are the opposite of expectations. With one indicating low risk and three as high risk, the resulting map was inverse of the expected results.
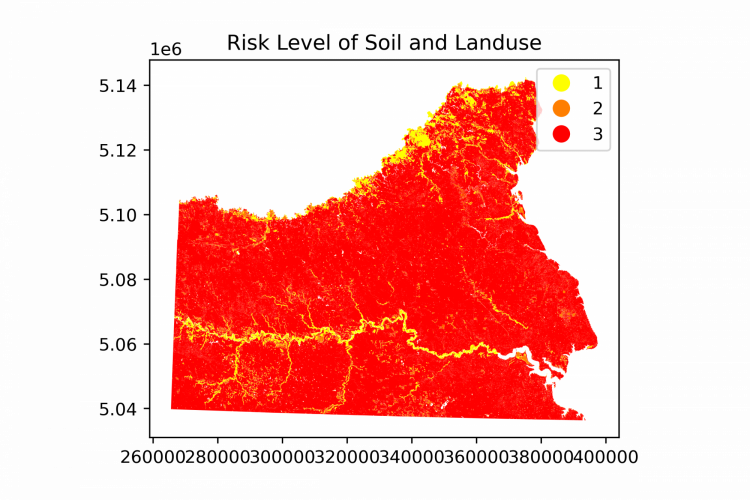
The most likely cause stems from CN value assignments made to the Land-use layer. The information that we were working with did not contain a complete array of CN values for all Land-use types. Instead, the data’s focus was agricultural lands. Additionally the St. Lucia document’s study sight was an island so there is also reason to believe that the reassignment of CN value to Risk Level may need alterations for an inland location. Instead of CN values of less than 40 qualifying for low risk, inland might receive more accurate results with CN values less than 50 qualifying for low risk. We believe the same issue exists for slope data, thus we increased the ranges used in the St. Lucia paper by a multiple of 10.
Overall, we are proud of the code that we created as an initial base for the analysis. We believe that the foundation created will enable the continuation of building a code that will be able to take user inputs and export a final map with eases. We cannot guarantee that those who will use the code will have a python background, which is why one of our goals was user ease. Down the line, the incorporation of a simple user interface for the code would be possible.
Moving Forward
The project will require the following work:
-
Inclusion of precipitation data using interpolation
-
Identifying a way to improve the Land-use portion of CN values
-
Verifying that risk ranges for each variable are appropriate
-
User interface?