Mapping Rooftops using Satellite Imagery and Zillow Data
Summer Graduate Research Assistant, Maxwell Cook, Discusses Mapping Rooftops using Satellite Imagery and Zillow Data
Maxwell Cook, Cibele Amaral, Jennifer Balch, Johannes Uhl, Stefan Leyk
Earth Lab GRA Summer 2023
Open Philanthropy Project (OPP)
We live in an increasingly flammable world
Recent events have highlighted the costly interactions between growing populations in hazard-prone regions, wildfire exclusion, and the spread of highly flammable exotic grasses; all while we experience increasing frequency of extreme fire weather days. Some of the most destructive wildfire events on record have occurred in recent years, such as the 2018 Camp Fire, 2021 Marshall Fire, and, tragically, the recent 2023 Maui fires. Understanding how fuels in the built environment (e.g., the Wildland Urban Interface [WUI]) affect fire behavior and subsequent damages is an urgent task to support mitigation and adaptation policies focused on decreasing the impacts of future wildfires.
Urban fuel estimation represents a critical research gap
While most studies have focused on the characterization of vegetative fuel on the landscape, far fewer have focused on urban fuels, including the discrimination of building materials and their spatial distribution. However, characteristics of the built environment (e.g., materials flammability, arrangement of structures) influence the outcomes of natural and human-made hazards (e.g., structure loss, emissions from smoke, etc.). We lack the necessary data to inform fire spread models within the built environment, models which we have successfully implemented in wildland settings. Quantifying urban and semi-urban fuels is a critical step towards integrating these social-ecological systems into current fire behavior and risk models.
https://www.denverpost.com/2021/12/31/marshall-fire-boulder-county-friday/
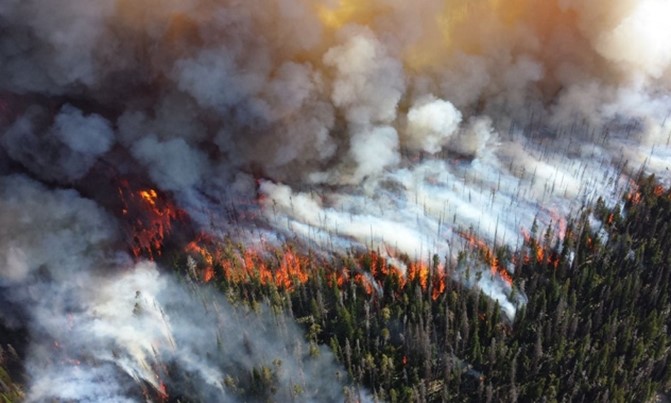
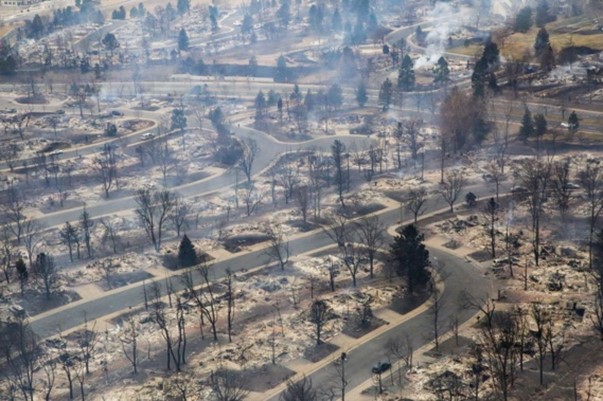
Studies characterizing vegetative fuel (left) are far more common in the context of wildfire behavior and impacts. However, as WUI disasters like the Colorado Marshall Fire in 2021 (right) continue to impact society, we must rethink how we characterize fuel on the landscape. Credit: (left) Union of Concerned Scientists, (right) Denver Post.
Roof materials: a piece of the urban fuel puzzle
Building materials can influence the likelihood of structure survival during a wildfire event. While roofing material is only one piece of the urban fuel puzzle, it represents a key component of building susceptibility and can inform large-scale planning efforts for home hardening or retrofitting (Headwater Economics, 2022). Additionally, roof materials are somewhat of a “low-hanging fruit” for urban fuel characterization in that they can be visually assessed using satellite data. With growing access to high-resolution satellite imagery (i.e., < 4m), building information and spatial distributions, novel applications of machine learning algorithms, and computing resources, we have new opportunities to characterize roofing materials with high precision and accuracy.
Towards estimating roof material type using satellite imagery and Zillow data: A case study in Washington, District of Columbia
In this work, we leveraged information from the Zillow Transaction and Real Estate Database (ZTRAX), which contains detailed information about structures, including the roofing material type. We joined the spatial points from ZTRAX to their likely OpenStreetMap (OSM) building footprint (hereafter ZTRAX-OSM), giving us a spatial representation of the structure and its roof materials. These data provide a source of information that can be related to satellite imagery to extract spectral information for each roof material type.
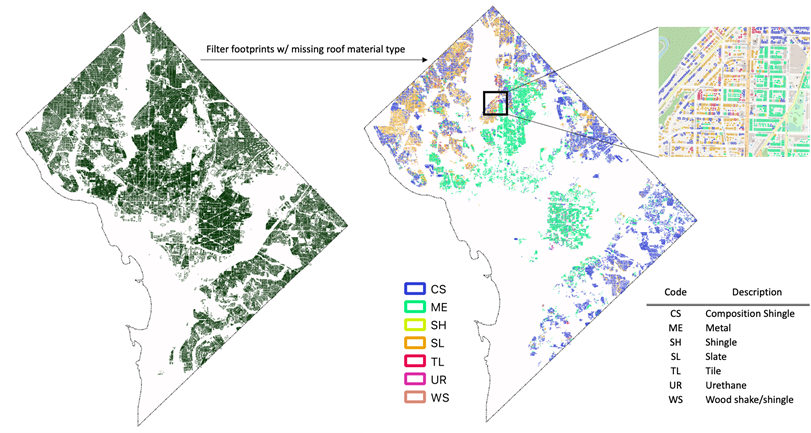
Figure 1. Spatial distribution of buildings and roof material type in Washington, District of Columbia. Data collection involved joining the OpenStreetMap (OSM) building footprint data with ZTRAX records to obtain spatial building footprints with attribute information, including building material types. We filtered footprint data to keep records with some information about the roof material.
We acquired satellite imagery from Planet Labs for the D.C. study area during a cloud-free summer day in 2022. Specifically, we leveraged the PlanetScope SuperDove 8-Band surface reflectance data product. The imagery was collected on June 6, 2022, over two tiles. We radiometrically corrected and color-balanced the tiles to generate a single composite scene.
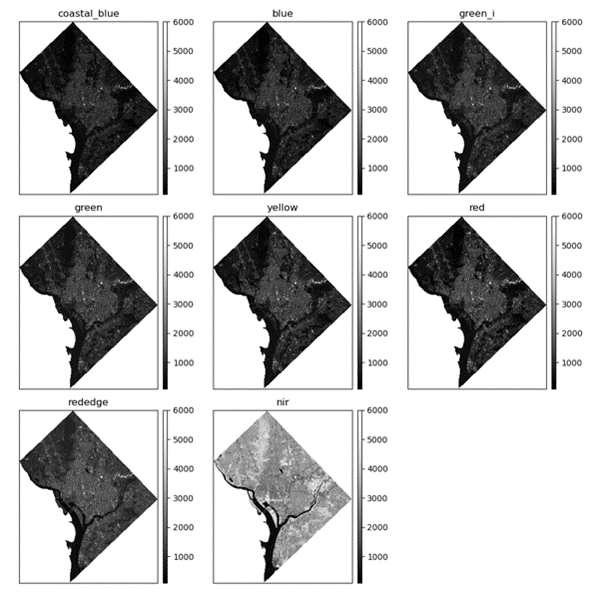
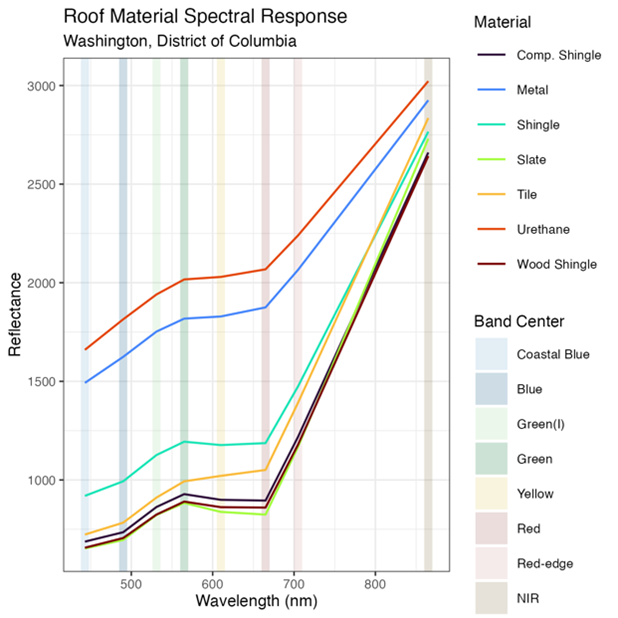
Figure 2. PlanetScope SuperDove imagery over Washington, District of Columbia, June 6, 2022, and rooftop material spectral response. The SuperDove sensor collects imagery over 8 spectral bands ranging from the visible to the near infrared (NIR). We used the ZTRAX-OSM footprints to calculate the spectral response of 7 roof material types to this imagery.
In addition to the 8 original spectral bands, we calculated 5 spectral indices, which have been shown to improve urban land cover mapping in various studies (e.g., Javed et al. 2021). We hope to improve the distinction between roof material types by including additional bands.
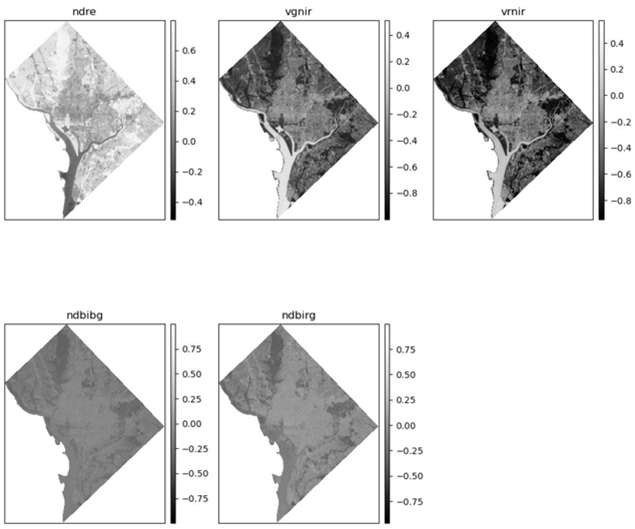
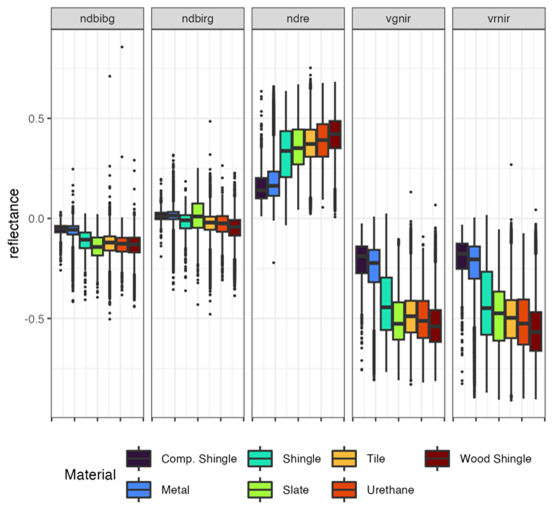
Figure 3. PlanetScope SuperDove spectral indices and roof material response. We calculated an additional 5 bands from our original imagery. These indices provide more spectral detail and can help us discriminate between the different roof material types.
Using this 13-band image composite, we can start to train models to identify roof material types. Our first step in this process is to refine our training data (ZTRAX-OSM) to include only the most pure or representative samples. Image classification tasks are only as good as the training data you can provide, after all! To do this, we implement a Spectral Mixture Analysis (SMA) which provides us with an estimation of the abundance of each material type for every pixel in our image. In general, SMA performs best when reducing the input bands to their variance. There are multiple ways to do this, but we use the Minimum Noise Fraction (MNF) reduction, similar to a Principal Components Analysis (PCA).
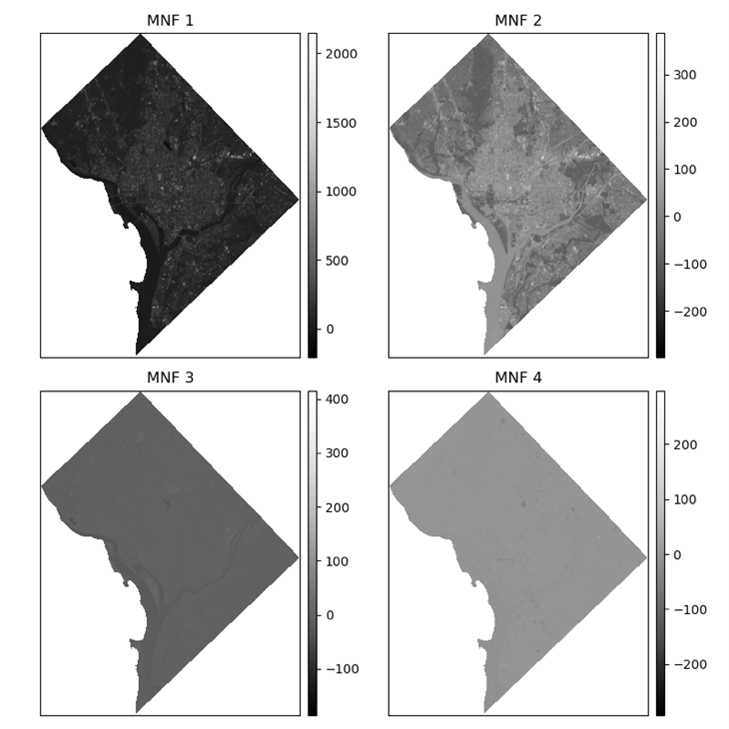
Figure 4. Minimum Noise Fraction (MNF) image reduction. We used the MNF transformation to reduce our 13-band image to principal components. The results indicate that we can realistically use just the first two components, which describe 98% of the variance in our imagery. Shown here, MNF 3 and 4 are largely noise (e.g., you cannot distinguish much between pixels).
Next, we can run the SMA using our first two MNF components. This process is computationally expensive, so we leveraged the Amazon Elastic Cloud Computing (EC2) to parallelize the work over 64 cores. The SMA requires selecting pure samples (endmembers) from our training data. We accomplished this using a measure called the Pixel Purity Index (PPI). Using our sampled training data (Figures 2 and 3), the PPI finds which samples represent each class most.
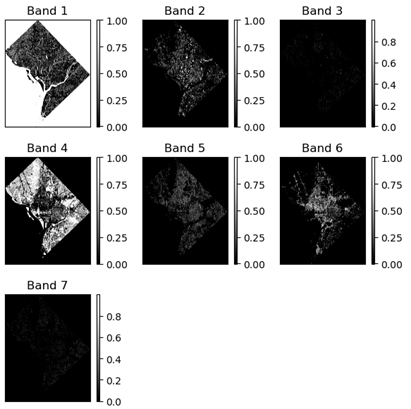
Figure 5. Results from the Spectral Mixture Analysis (SMA) of roof material types. The SMA provides us with an estimate of the abundance of each roof material type per pixel.
Finally, we can use the results from our SMA to identify ZTRAX-OSM footprints that contain >90% of the respective material type assigned by the ZTRAX attributes. This enables us to filter out footprints that may be covered by tree canopy or otherwise obstructed in our imagery.
Next steps: Classifying roof material types
Moving forward, we will leverage a Convolutional Neural Network (CNN) classifier to generate a map of roof material types for Washington, D.C. Specifically, we are testing the Resnet-18 model, which has been shown to be effective for land cover mapping of remote sensing images. By classifying at the building footprint level, we can start to build models that can be applied to other geographic regions, providing critical data on roofing type in potentially hazard-prone areas.
Stay tuned for more updates as we progress in this research!
List of Resources and Citations
GitHub: https://github.com/maxwellCcook/opp-urban-fuels/tree/main/rooftop-materials
Headwaters Economics Report: https://headwaterseconomics.org/natural-hazards/wood-roofs-wildfire/
Javed, A. et al. Review of Spectral Indices for Urban Remote Sensing. Photogrammetric Engineering & Remote Sensing 87, 513–524 (2021).
Frazier, A. E. & Hemingway, B. L. A Technical Review of Planet Smallsat Data: Practical Considerations for Processing and Using PlanetScope Imagery. Remote Sensing 13, 3930 (2021).
Somers, B., Asner, G. P., Tits, L. & Coppin, P. Endmember variability in Spectral Mixture Analysis: A review. Remote Sensing of Environment 115, 1603–1616 (2011).
Yang, C. et al. Improving Land Use/Land Cover Classification by Integrating Pixel Unmixing and Decision Tree Methods. Remote Sensing 9, 1222 (2017).