Have U.S. Wildfires Recently Worsened?
Our recent paper https://www.science.org/doi/10.1126/sciadv.abc0020 finds that wildfires across the contiguous United States have become larger, more frequent, and more widespread in recent years.
Have U.S. wildfires recently worsened?
Yes! And are likely to keep getting worse for the foreseeable future.
Since around the year 2000, wildfires are up to four times the size, triple the frequency, and more widespread than in the previous two decades across the contiguous United States. And the most extreme fires are larger, more frequent, and more likely to co-occur with other extreme fires. This documented shift in burning patterns across most of the country aligns with the perceived change in fire dynamics noted by the media, public, and fire fighters, and is supported by studies showing worsening fire weather and climate conditions in the U.S. , and globally .
Wildfire data series for the U.S. are less consistent than, say, the climate record, built as they are on observer and firefighter field reports along with, since the 1980s, satellite data that must be regularized across different sensors and satellites. But efforts by the US Forest Service, other agencies, and fire researchers have now yielded a research-grade time series of wildfire with consistent data reaching back to the early 1980s, the “Monitoring Trends in Burn Severity” (MTBS). We analyzed the over 28,000 fires in the MTBS 1984-2019 to:
(1) Test for the presence of shifts in number of fires and area burned;
(2) Describe fires before and after shifts in terms of size and frequency; and
(3) Quantify how these differences affected the spatial aggregation and probability of co-occurrence of fires, especially the most extreme fires.
Our goal was to rigorously assess the widespread sense that fire behavior has changed across the contiguous US in the last decade or so, recognizing that public perception and media coverage do not always reflect earth system realities (show us the numbers!), and that knowing about trends is critical as we reassess fire-mitigation efforts and strategic resource allocation.
You can read the details of our analysis at: https://www.science.org/doi/10.1126/sciadv.abc0020
What We Did
We divided the contiguous U.S. into East, Great Plains, and West regions and sent five different algorithms through the three regional time-series to find break points. This is akin to asking five intelligence agents (artificial, in this case) of different perspicacity to look for changes lurking in the data. Not all artificial intelligences are created equal: they had different statistical skills, handicaps (that is, penalties for being wrong---if you want to know, those were: p-values, Bayesian Information Criterion, deviance reduction, and penalized likelihood), and assumptions about the basic structure of the fire data (Gaussian, Negative Binomial, or distribution-free). We then let them vote on the breakpoints they found. Lastly, we characterized fire frequency, size, and spatial arrangement before and after these breakpoints.
What We Found
U.S. wildfire patterns shifted around the year 2000. All five algorithms identified structural changes in the time series of weekly-area-burned in the West and Great Plains, and median-fire-size in the West, during 1998-2002, while three saw shifts in weekly-area-burned in the East and fires-ignited-per-week in the West, over the same period. Two breakpoints emerged for fires-ignited-per-week in the Great Plains, 1999 and 2005, supported by three and four algorithms, respectively. No changes in median-fire-size in the Great Plains or East were indicated by more than one test.
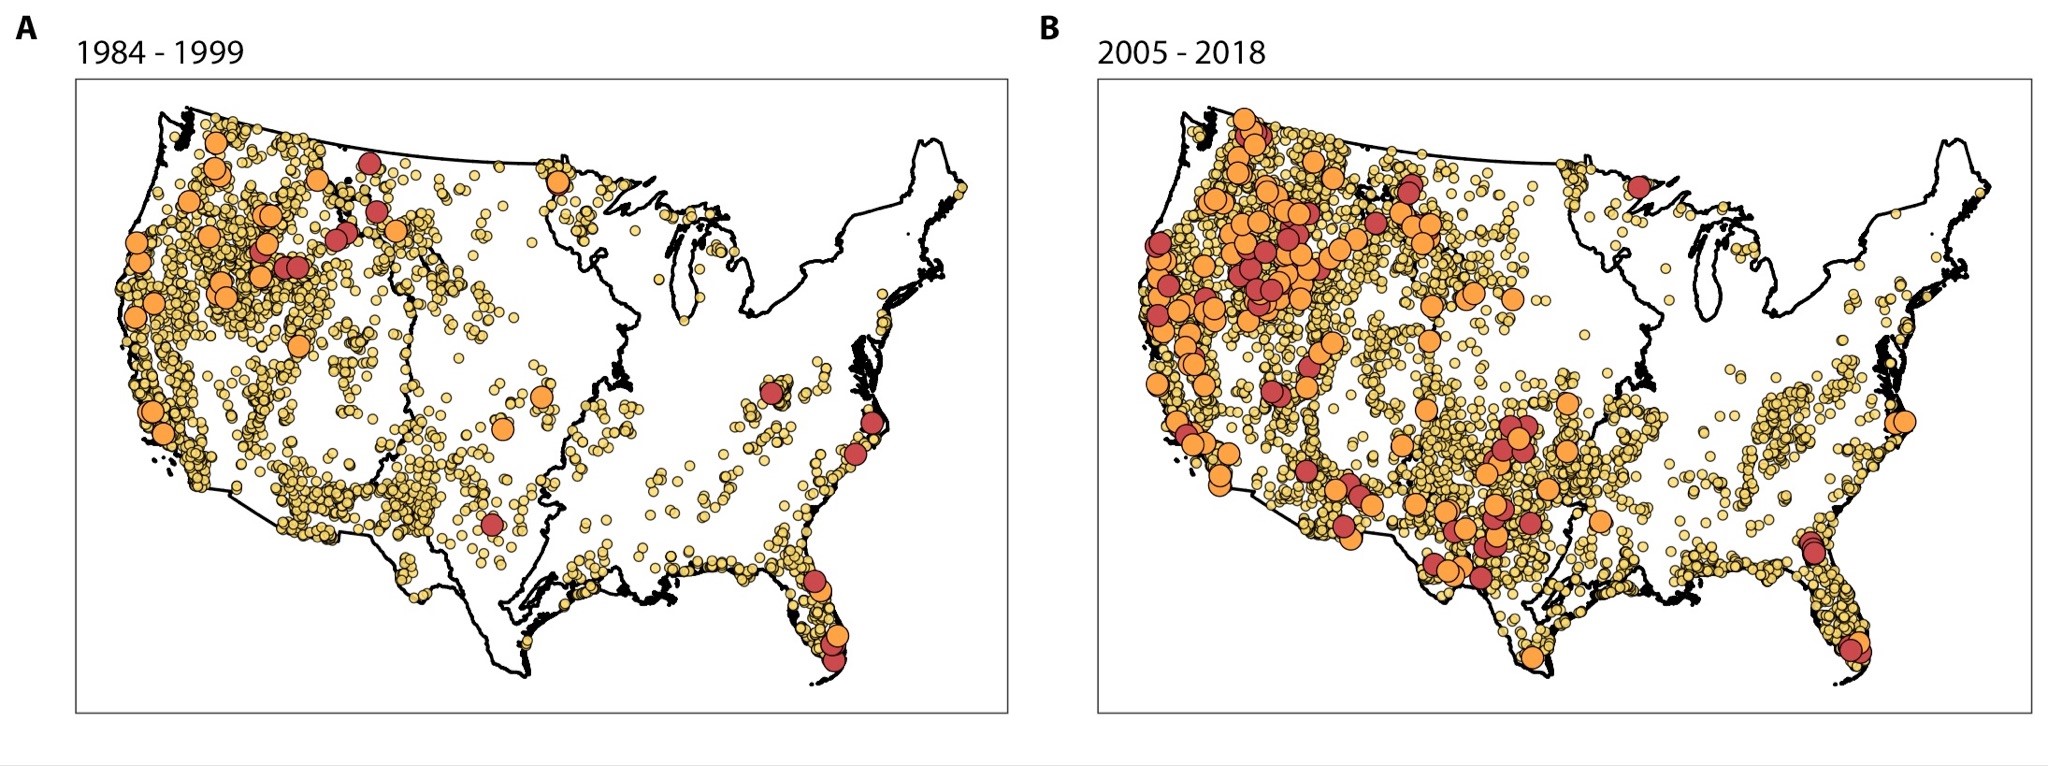
So, we’re confident in saying that all parts of the U.S. have been affected by more fires since around the turn of the century than in the two previous decades (Fig. 1).
We also found that the subset of the largest fires---those whose size is exceeded only 1% of the time—increased in number after the ca.1999 tipping point, from 23 to 92 in the West, 3 to 23 in the Great Plains, and 3 to 10 extreme fires in the East. These large fires also crowded into the worst fire years—when conditions were right for extreme fires. This may be the key discovery: extreme fires are becoming more frequent, and they aggregate in extreme fire years. Many years feature only average fires, but when conditions are supportive of larger fires, then multiple extreme fires occur, stressing response resources.
Finally, we found hints at another disturbing trend in which wildfires occurred over more of the American landscape than in the past. Other wildfire researchers, including in our group, have found fires expanding into areas less historically subject to burning, and an expanding season when fires are likely.
So, it looks like wildfire became more frequent, bigger, and more widespread in the last couple of decades. The only countervailing finding was lack of increase in average East fire size. More and larger very large fires (top 1%) in this area coupled with expanding fire-prone areas make us think that as the data series grows longer we’ll soon see that signal in the East as well.
Why the change in fire regime?
Probably no single cause is driving changes in U.S. wildfire. Other researchers have found that the proximal causes of fires--- the ignitions necessary for every fire start----have increased and spread into less fire-prone seasons and into less fire-frequented ecosystems because of anthropogenic impact (e.g., arson, cigarette butts, power lines; https://www.pnas.org/doi/10.1073/pnas.1617394114 ). More, and more widespread, ignitions can explain more fires. But why are fires trending larger? And why did the change occur at about the turn of the century? Again, probably no single cause. Other researchers have found signals of multi-year swings in climate (like the Pacific Decadal Oscillation, PDO, and the El Nino Southern Oscillation, ENSO, in the western U.S. fire record). Simultaneously, fuel build-up and climate warming and drying have proceeded apace, reaching a stage at the start of this century when fuel and weather conditions conspire to support bigger and more frequent fires. Other research finds that western fires are not consuming fuel sufficient to dampen future fires, and fires are not quieting down at night as much as in the past (https://www.nature.com/articles/s41586-021-04325-1 ), suggesting larger fires will be around for some time to come. In any case, it does not appear that aggressive firefighting, or fuels mitigation, has managed to reduce fire hazard in the U.S. nor even reverse the palpable trend toward larger and more widespread fires.
A Worrisome Future
In a previous paper (https://agupubs.onlinelibrary.wiley.com/doi/full/10.1029/2020EF001795) we found hints that not only has the encroachment of development into fire zones increased, but that higher density development (houses, business, factories, warehouses, etc.) is poking into flammable landscapes. More fires in more places, plus more development in more places, portend badly for the future.
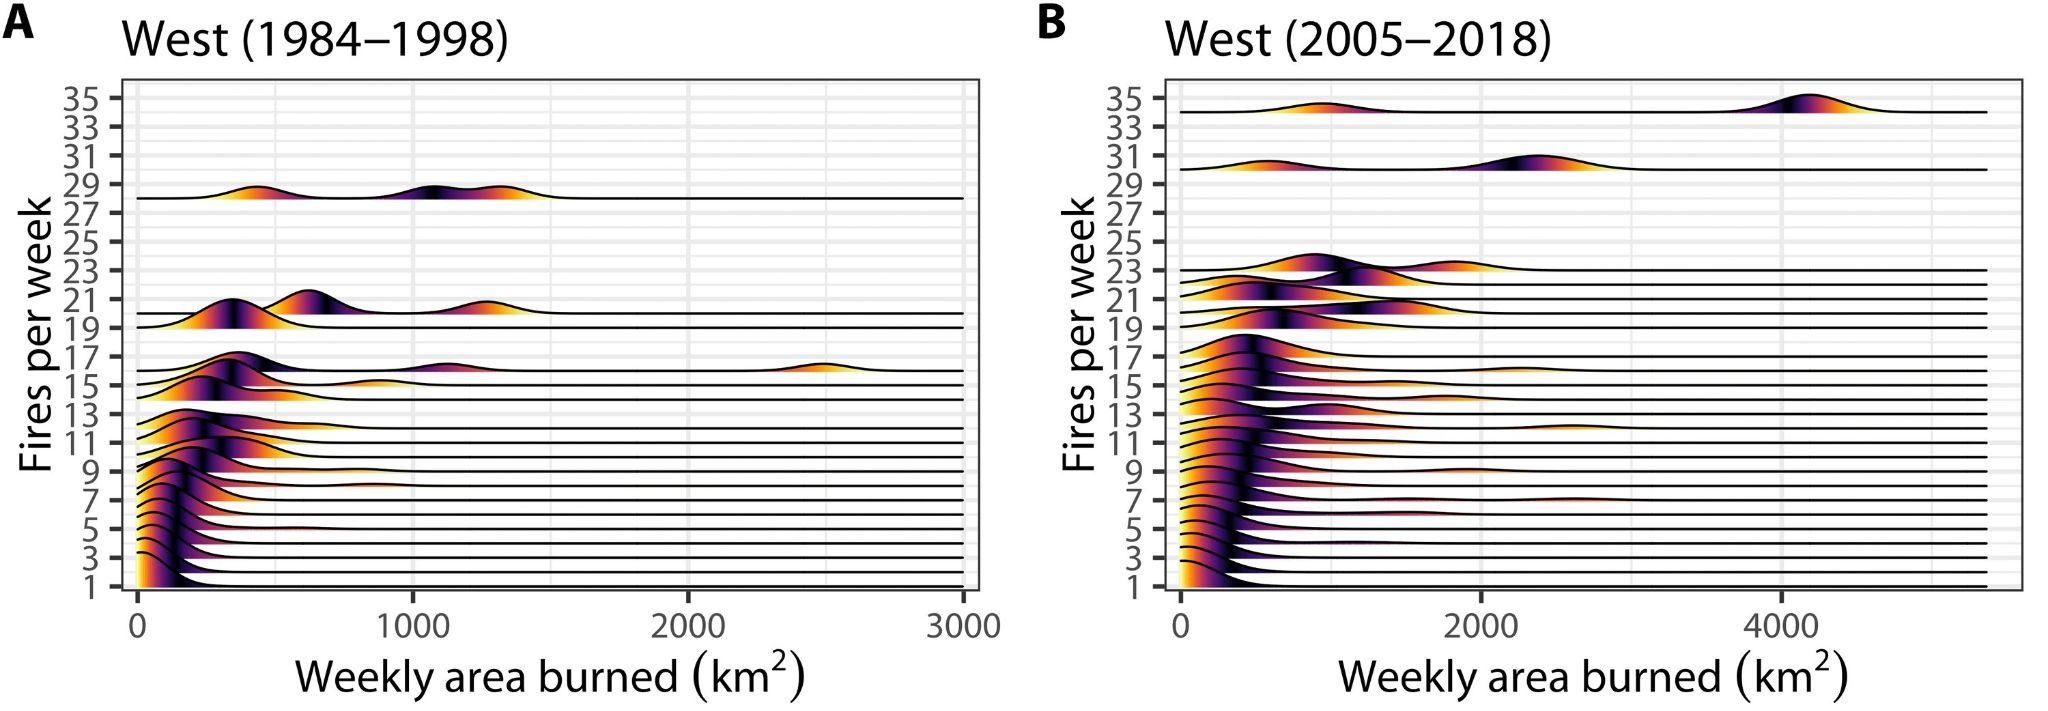
And the heavy-tailed distributions of fire size, especially in the West and especially this century (Fig. 2), means that we may not yet have seen the largest fires likely to occur. While increasingly large fires may eventually be self-dampening as they consume fuel built-up over decades, this effect has not yet shown up in the West, and fires are likely to get worse before they get better. The next largest wildfire may be many times larger than the previous record size, especially if the recent tendency of extreme fires to co-occur in time and space yields more fire complexes and mergers. We may be moving into the realm of what risk analysts call “dragon kings”: the largest events observed (“king”, as in king tides), and the largest events that our imaginations conjure up (“dragons”). The biggest fire disasters may yet be to come.