NC CASC: Climate Projections for Habitat Suitability
By Elizabeth Woolner, Michelle Leung, Kolondja Thillot, Faiza Sid-Ahmed, Gabe Williams, Drayton Kary
Mentors: Imtiaz Rangwala (NC CASC) and Bill Travis (Department of Geography, CU Boulder)
Introduction/Background
Future predictions of global climate change aim to estimate the scale and severity of climate change’s impacts, including how extreme conditions change, as a result of the increase in greenhouse gases in the atmosphere. As with any kind of future predictions, these projections are subject to uncertainty depending on the interactions between natural forces and human activity. However, by using several models, each accounting for slightly different factors, understanding and preparing for the future climate in an area is possible. In our project, we used common methods used to predict climate change to understand how these changes may affect the white-tailed ptarmigan, an alpine species in Colorado, and to assist land managers’ decision-making regarding these changes in climate.
For our project, we chose to analyze the future climate of an alpine tundra location within Rocky Mountain National Park in Colorado. Our species of focus was the white-tailed ptarmigan, a native bird that is specialized to the ecosystem. The alpine tundra is a type of tundra located at very high elevations, such as on the tops of mountains. These ecosystems are particularly vulnerable to climate change, as warming temperatures push other types of organisms up to higher elevations, and alpine tundra species’ habitats increasingly shrink (https://www.nature.com/articles/nclimate1514; https://www.tandfonline.com/doi/full/10.1080/14888386.2015.1117023). While alpine species are at high risk due to climate change, many other species will also feel its effects. Therefore, it is important for all land and wildlife managers to understand how their climate may change in the near future, which gives them an opportunity to prepare.
This project is a continuation of the work of our mentor, Dr. Imtiaz Rangwala, with the UGSG North Central Climate Adaptation and Science Center (NC CASC). Presenting land managers with climate modeling to assist with their decisions is a growing practice in the community, and we are grateful to contribute to this body of knowledge.
Methods
Our general process followed a typical data science pattern -- generating our guiding questions, obtaining our data, moving into working with the data, and then producing graphs and drawing conclusions. During this process, our team learned a great deal about the challenges of data science and the importance of visualizations to convey a message.
To generate climate projections, we used a dataset called MACAv2 (produced through the University of Idaho, https://climate.northwestknowledge.net/MACA/index.php), that incorporates twenty different climate models from around the world to estimate future changes to climate. This data is widely used by the scientific community to look at climate change impacts on a small area. Earth Lab, our host organization, has produced a Python extension called the Climate Futures Toolbox (https://www.earthdatascience.org/cft/index.html), that works with the MACAv2 dataset and further subsets it. Throughout this process, we also learned how to use an open-source NASA software download called Panoply to convert between different data types and work with large datasets -- our data for daily temperature alone had over two million different data points!
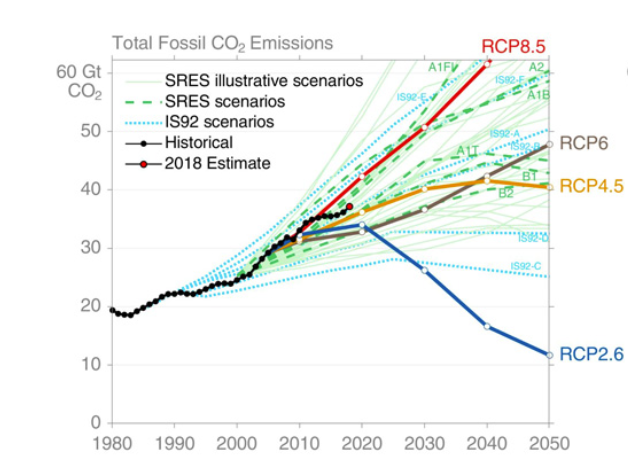
We also needed to determine what scenarios of future climate we wanted to examine. One of the most commonly used concepts within climate models is the Representative Concentration Pathway (RCP), which predicts the future trajectories of greenhouse gas emissions. Each pathway (RCP2.5, RCP4.5, RCP6, RCP8.5) illustrates different climate futures depending on the amount of greenhouse gases that are emitted. We chose RCP4.5 (some action taken to reduce emissions) and RCP8.5 (no action taken to reduce emissions) because they are the most commonly used scenarios by climate modelers and land managers.
Our study area had a resolution of 4x4 kilometers (about 4 square miles). Our variables were temperature (daily and monthly) and precipitation (daily and monthly) for both RCP4.5 and RCP8.5 emissions scenarios. As far as time frame, we used a 30-year period centered on 2050, as these are the decades most frequently used by land managers. Using this data, we created scatter plots and box-and-whisker plots in Python to visualize different climate futures for this alpine tundra region. Each type of plot has pros and cons associated with it and may provide different insights for land managers.
Analysis
For one of our analyses, we created scatter plots comparing the maximum daily temperatures (Fahrenheit) and max daily precipitation (millimeters). Each of the points on the plots represent one of the twenty climate models in the MACAv2 dataset. Each of the colored points in the plot represents different emission scenarios including: the historical time period (1971-2000), RCP 4.5, and RCP 8.5. The red and blue dashed lines indicate the White-tailed Ptarmigan maximum temperature and maximum precipitation threshold that our project determined based on our mentor’s previous work with the species. When comparing the two graphs we see that there are more climate models crossing the threshold in future years, forcing the White-Tailed Ptarmigan to be at risk in the future as climate continues to change.
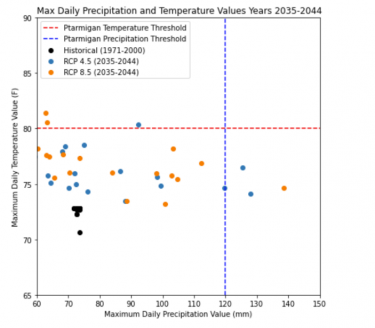
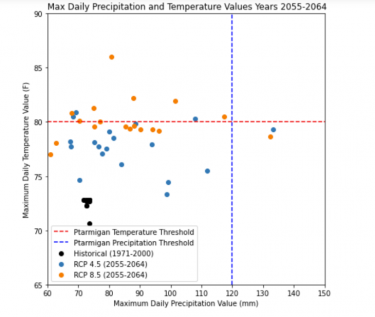
Figures 2a and 2b: Scatter plot of two future decades (2035-2044 and 2055-2064) comparing Max Daily Temperature and Max Daily Precipitation.
While the scatterplots show the interaction between two variables, box-and-whisker plots take a more in-depth look at a single factor, in this case, temperature extremes. Each column shows the aggregation of the 20 different MACAv2 models, similar to the scatter plots. The middle line on the box represents the mean of all the models, the box represents the 50% confidence intervals, and the “whiskers” represent the 95% confidence intervals. Between these visual factors, this gives land managers a good understanding of the changes to temperature extremes in the future and the uncertainty with those estimates.
Our analysis focuses on extremes only, which is an important part of climate science but not the only part. With our data, we are not able to characterize the changes to climate in this region for the entire year or as an average, and therefore we cannot definitively say whether the entire climate of this alpine tundra is warming or becoming more wet. However, our findings are still illustrative of how extreme temperatures and precipitation days are rising above what we’ve observed historically, and that they may provide environmental shocks to the white-tailed ptarmigan.
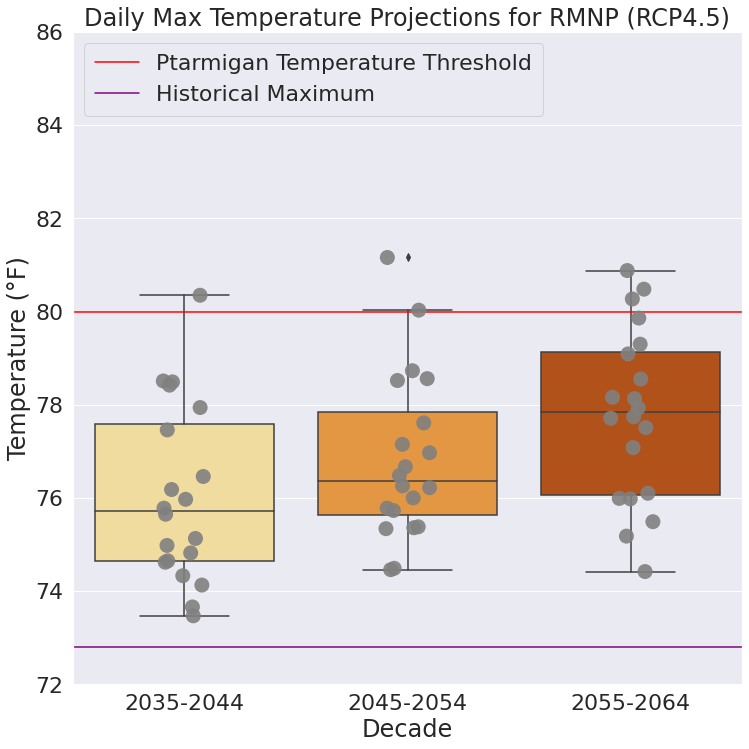
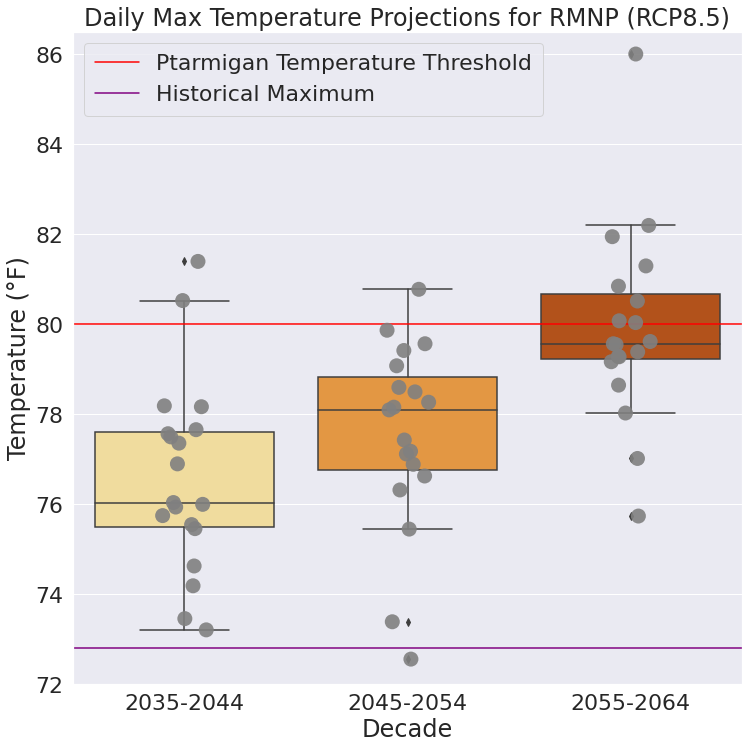
Figures 3a and 2b: Box and Whisker plots of three future decades (2035-2044, 2045-2054, 2055-2064) comparing changes to daily maximum temperature. Left: RCP4.5 (lower emissions). Right: RCP8.5 (higher emissions).
Conclusion
In our analysis, we observed a general increase in temperature and precipitation extremes for our alpine tundra region. With these extremes, the white-tailed ptarmigan (which is currently not endangered) may become threatened due to its sensitivity to climate change. These findings may enable land managers charged with maintaining populations of the bird to take action to minimize these effects and protect the species.
There are numerous opportunities for this project to be expanded in the future. Some possible directions we see for this project are improving species threshold estimates, seeking land managers’ feedback on improving these tools, exploring multiple visualization styles as well as other variables (such as solar radiation), and applying these methods to other species or ecosystems. We are excited to see where this may lead for our team or other groups in the future.