Predicting Streamflow Data from Snowpack: An Exploration
An exploration of how we can predict streamflow data from snowpack
CU Boulder Project: Predicting Streamflow Data from Snowpack: An Exploration
EDSC Interns:
Isabella Monaco: Major: Environmental Studies; Minor: Atmospheric and Oceanic Science
Michela Johnson: Environmental Engineering
Mike Tran: Majors: Geography and International Affairs; Minor: Arabic
Rita Kamenetskiy: Majors: Biochemistry and Spanish Language & Literature; Minors: Political Science and Ecology & Evolutionary Biology
Sofia Vakhutinsky: Majors: Geography and Economics; Minors: Atmospheric and Oceanic Science, Geology
Project Mentors:
Bill Travis: University Director, Adaptation Co-Lead, CU Boulder at North Central Climate Adaptation Science
Imtiaz Rangwala: Climate Science Lead, CU Boulder at North Central Climate Adaptation Science
Prasad Thota: Ph.D. student in Civil Engineering at CU Boulder
August 5th, 2022
The CU Boulder team acknowledges that the University of Colorado at Boulder campus resides within the traditional territories of the Ute, Arapaho, Lakota, and Cheyenne nations. The study location where we gathered our data resides within the traditional Dine Nation, Ute Native American Tribe of the Uintah and Ouray Reservation, and Ute Mountain Ute Tribes.
Introduction:
The Colorado River is a critical resource for the western United States. Its basin drains a massive area covering around 250,000 square miles (around 8% of the area of the continental U.S.), including parts of seven states: Wyoming, Colorado, Utah, New Mexico, Nevada, Arizona, and California. The river provides not only a source of water for these U.S. states but also 29 Native American tribes and the states of Sonora and Baja California in Mexico. The various anthropocentric uses of the Colorado River include water for consumption, agriculture, hydroelectric power, and recreational purposes, in addition to its natural role in providing a habitat for fish and other wildlife. Nearly 40 million Americans depend on this water resource for their livelihood.
Since 2000, the Colorado River basin has been experiencing a historic drought that threatens the water supply of tens of millions of people and countless wildlife. Throughout the summer internship, the CU-Boulder team analyzed hydrology data from SNOTEL and stream gauge sites using the NWCC (National Weather and Climate Change) and DWR ( Colorado Department of Water Resources) gauge sites across the Rocky Mountains in Colorado. We hope this research will help predict future trends in the water supply and flow of the Colorado River and help inform and guide sustainable and equitable usage for the future.
Water History Section:
The Colorado River is considered one of the most important, if not the most important, rivers in the Western United States, providing water for seven states. Quantifying its importance in economic terms, each year, the Colorado River supports about $1.4 trillion in economic activity and 16 million jobs within its basin. During the early 1920s, western states were anxious to learn their share of this precious resource. Fearing that California would gain the most significant amount of water due to its population (which was controversial as they contributed the least amount of runoff back into the river), a debate ensued about how much water each state would receive. After much discussion, the Colorado River Compact created in 1922 decided how states would allocate the Colorado River between the Upper and the Lower Basin States. The Upper Basin States include New Mexico, Wyoming, Utah, and Colorado. As the Lower Basin is made up of Arizona, Nevada, and California. Each basin was estimated to have 7.5 million acre-feet (MAF) per year, divided among states. Estimations at the time indicated the annual flow of the Colorado River to be 16.4 MAF at Lees Ferry. However, this was not the case between three centuries of average annual flow of about 13.5 MAF. Adding pressure to the sensitive topic, the flow was volatile, ranging from 22 MAR to 4.4 MAF annually.
This created issues about the originally promised and the reality of what the river delivers yearly. Water scarcity is an issue connecting the past with the present. It will continue to be a concern for those relying on the Colorado River for water. To this day, states are clashing with one another to negotiate water rights as they supervise growing populations and the urgent need for more water to accommodate this influx. While population growth continues, the country also sees land use and management changes. Within Colorado, water use has shifted from a rural/agricultural landscape into an urban and suburban one. However, irrigated farmlands account for around 16% of the state's land use but use 85% of total water diversions. This allocation of resources could not be sustained for future uses. The Colorado River is exceptionally vulnerable to overuse, poor river management, and other environmental concerns jeopardizing water quality. In combination with new environmental and weather extremes brought by climate change, the future of the river and the states relying on it is uncertain. The umbrella question remains: what will the future hydrology and geography of the Colorado River look like?
Significance and Issue:
Researchers have identified the upper basin of the Colorado River as an overallocated water source with increasing demands from the two countries that rely on its continuous output. Growing demands on an already stressed river system, coupled with climate change, reservoir evaporation due to rising temperatures, and increased agricultural water demands, may put water users and resources that rely on the constant flow of the Colorado River at risk of prolonged drought and water shortages in the near future. Our research investigated this future water shortage with spring and early summer runoff reductions. To identify projected water supply imbalances that can help make more informed decisions about allocation and demand. The issues caused by water imbalances create problems for vegetation and wildlife management, severity and frequency of wildfires, and erosion leading to flooding and landslides.
Our Study Area: The Upper Colorado River Watershed:
We used Python code, largely using the package Folium, to visualize the streamflow gauge and SNOTEL sites shown below.
-Blue sites represent streamflow
-Red sites represent SNOTEL
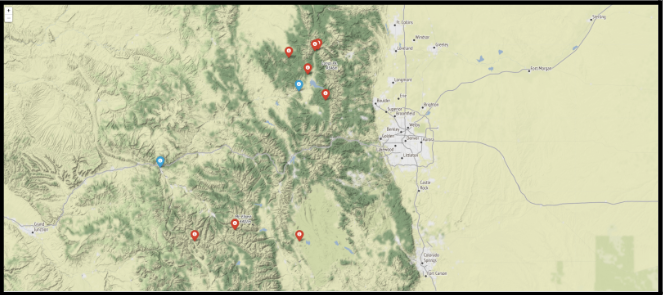
- Link of Folium Map showing Colorado River basin, Native American tribal lands within the basin, and urban areas that rely on water from the basin (Note: after clicking on map, scroll all the way down): https://astounding-bombolone-241b88.netlify.app/
There is critical importance to studying changes in streamflow and snowpack within the Rocky Mountain National Park due to the impact of the watershed on hydrology, ecosystem services, and human reliance. This significance guided our curiosity about this project's scope and emerged two significant questions:
| How does maximum snowpack affect total annual streamflow in the Upper Colorado River Basin? | How accurately can we predict future stream flows from snowpack data? |
Methods:
We began collecting data from two streamflow sites: the Colorado River at Windy Gap Near Granby, Colorado, and Roaring Forks at Glenwood Springs, Colorado. These streamflow sites gave us two discharge measurements: Cubic Feet per Second (CFS) which measures the volume of water passing any given point on the river in one second, and secondly acre-feet which measures water one-acre foot equaling 326,000 gallons or enough to cover an acre of land one foot deep.
We also collected data from snow gauge sites (SNOTEL) at Phantom Valley, Lake Irene, Willow Creek Pass, Independence Pass, Kiln, and Mc Clure Pass. These SNOTEL sites provided historical data for Snow Water Equivalent (SWE) measurements. SWE measures snow that accumulates over time and is used to gauge the amount of liquid water contained within the snowpack. The timeframe for our SNOTEL and streamflow sites was set from 1982 to 2021.
Analysis:
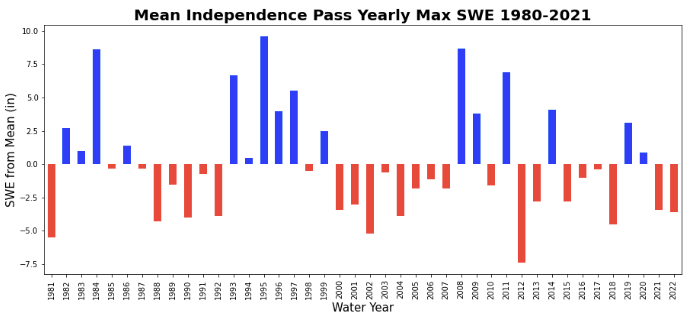
We started the analysis by calculating the annual max SWE from each SNOTEL site. We then looked at only a couple of SNOTEL sites and plotted the difference from the mean of the data for the past 40 years to see if we could see any trends. As shown in the graph below, we saw that for the first approximately 20 years of the data, the values are cyclical with several years of dry years followed by several years of wet years. However, in the past 20 years not only is the data a lot more variable, but only 6 out of those years were wetter than average which could have been potentially because of climate change and the resulting droughts we have seen in recent years.
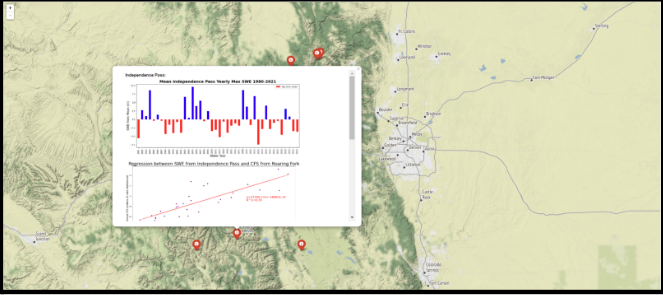
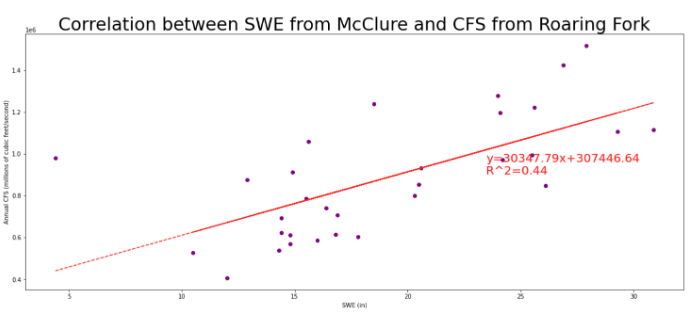
We then created regression models between those SWE values and the max discharge (in acre-feet) values from the respective streamflow gauge sites (e.g. the SNOTEL site at McClure is located within the Roaring Fork sub basin of the Colorado River, which we represented using the Roaring Fork stream gauge site located at Glenwood Springs). The linear regression below models the relationship between SWE and stream flow, with the two being the independent and dependent variables. The R2 value is how much of the variability within the dependent variable is explained by the independent variable. Here, 44% of the variability within the streamflow is explained by SWE.
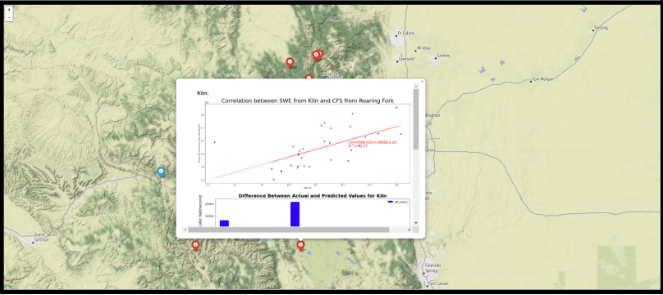
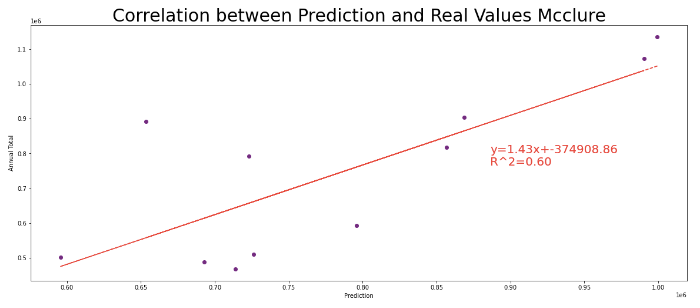
We performed regressions on the first 30 years of our datasets, from the years 1980-2010, approximately, to get a line of best fit which is shown next to the line in the figure above, which we then used to predict the next 10 years of data, so from 2010-2021. The reason for predicting something in the past was so we could actually see how well our model was able to predict the flow for several years into the future. To test this, we ran another regression with the predicted and actual data an example of which is shown in the graph below. Although the R2 value is still only really a sign of variability, this high a value suggests that our model is at least somewhat accurate in its predictions.
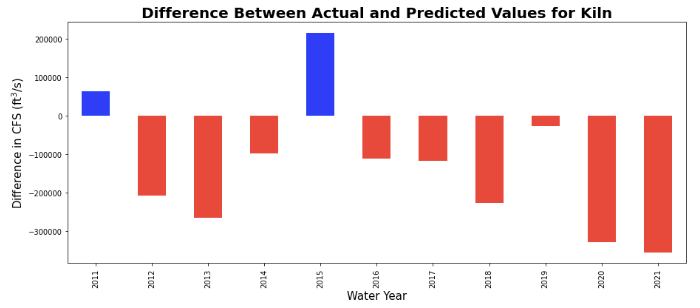
To further help visualize these predictions we also graphed the difference between the predicted and actual values. In the example below, it’s clear that the model tended to over-predict the amount of discharge, however, it could also be a sign that we are getting less and less water than expected.
Afterward, we theorized that we could develop greater R2 values by running a multiple regression model, using multiple SNOTEL sites for an individual river gauge site. Here we added Independence Pass to the model, and subsequently, the R2 increased significantly to 75%.
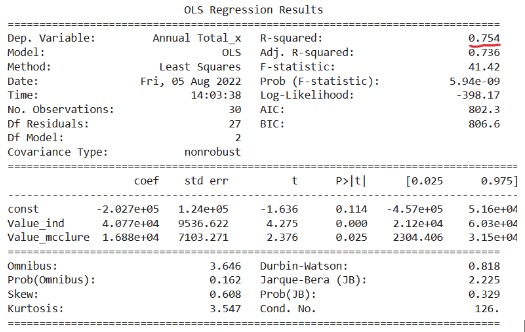
We then performed the same process described above to see how accurately our new models could predict future discharge values. To do this, instead of getting an equation on the graph, the coefficients from the regression results above have to be plugged into a new equation with the form:
y = m1x1 + m2x2 + b
In this equation, y is the discharge value, m1 and m2 are the coefficients of the SNOTEL sites with b being the intercept.
Below is an example of a graph of the regression run between the predicted and actual values derived from the multiple linear regression above.
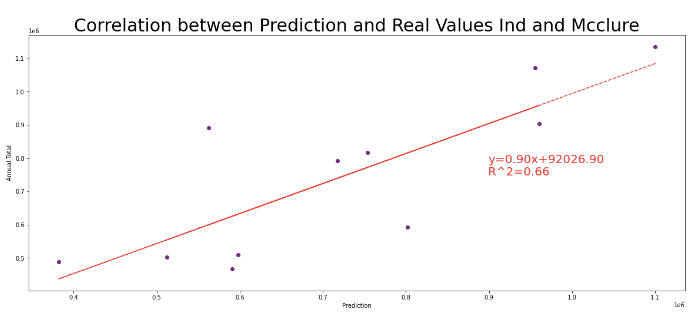
Comparing this graph to the prediction regression run with only the McClure site, we can see that the R2 value has increased, which means that the multi-linear regression not only better represents the variability in the historical data but also does a better job of predicting future discharge as well.
Results and Conclusions:
The data analysis, using linear regression of multiple SNOTEL sites, provides similar, if not more accurate, results than any regressions run with only one SNOTEL site. Considering that not all water flow is reflected by any singular station, accounting for more stations decreases the unaccounted variability in the hydrology data. Even given small sample sizes, almost all the locations predicted more streamflow than the training (real) data. We concluded that this likely means the climate will get warmer and drier over time. This drier climate leads to less snowpack forming and less water content in the snowpack that does form, which leads to less water contributing to streamflow when it melts.
Although there are still many other factors (e.g., soil moisture, wind, temperature, non-snow precipitation) that need to be accounted for before SWE can directly be used to predict discharge data, communities dependent on the Colorado River should at least be able to gather a sense of how much water will be available for an upcoming year and be able to plan accordingly. Given our results, suggestions for better future predictions include increasing SNOTEL infrastructure at higher elevations to counter the likelihood of melting events, increasing streamflow monitoring sites where streams are likely to freeze, monitoring streamflow below surface ice to counteract zero or null data for streamflow measurements, and implementing precipitation measurements with the streamflow monitoring tools for a more accurate representation of discharge. Hopefully, with these additions, government agencies at local, state, and federal levels can quickly and accurately predict the streamflow of the Colorado River to where effective action to conserve and distribute water resources equitably can be carried out both in the short and the long term for the benefit of all peoples, especially those who are currently the most vulnerable to climate change like BIPOC and rural communities.
Sources:
CDSS Data & Tools. (n.d.). Retrieved August 5, 2022, from https://dwr.state.co.us/Tools/
Colorado River Compact. (2022). In Wikipedia. https://en.wikipedia.org/w/index.php?title=Colorado_River_Compact&oldid=1096823132
Farmland Information Center. “Colorado Data and Statistics,” 2017. https://farmlandinfo.org/statistics/colorado-statistics/.
Gelt, Joe. “Sharing Colorado River Water: History, Public Policy, and the Colorado River Compact.” University of Arizona Water Resources Research Center, December 9, 2011. https://wrrc.arizona.edu/publications/arroyo-newsletter/sharing-colorado-river-water-history-ppublic-policy-and-colorado-river.
Hart, Robert, and Richard Hooper. “Monitoring the Water Quality of the Nation.” Government. USGS, February 2000. https://pubs.usgs.gov/fs/fs-014-00/.
Howe, Ben Ryder. “Wall Street Eyes Billions in Colorado’s Water.” The New York Times, January 3, 2021, sec. Business. https://www.nytimes.com/2021/01/03/business/colorado-river-water-rights.html.
Mission 2012: Clean Water. (n.d.). Retrieved August 5, 2022, from http://web.mit.edu/12.000/www/m2012/finalwebsite/problem/coloradoriver.shtml
National Integrated Drought Information System. “Colorado Region Conditions | Drought.Gov.” Accessed August 7, 2022. https://www.drought.gov/watersheds/colorado.
NWCC Report Generator. (n.d.). Retrieved August 5, 2022, from https://wcc.sc.egov.usda.gov/reportGenerator/
Outcalt, Chris. “Agriculture Accounts for Most of Colorado’s Water Use. How Much Water Savings Is Possible on High-Country Hay Meadows?” The Colorado Sun, July 7, 2022. https://coloradosun.com/2022/07/07/agriculture-colorado-water-savings-high-country-hay-meadows/
Paoletta, Kyle. “‘We Woke Up and We Lost Half Our Water.’” Intelligencer, April 21, 2022. https://nymag.com/intelligencer/2022/04/the-multistate-battle-over-the-colorado-river.html.
Sharing Colorado River Water: History, Public Policy, and the Colorado River Compact. (2011, December 9). Wrrc.Arizona.Edu. https://wrrc.arizona.edu/publications/arroyo-newsletter/sharing-colorado-river-water-history-public-policy-and-colorado-river
Stillwater Creek (793)—Site Information and Reports. (n.d.). Retrieved August 5, 2022, from https://wcc.sc.egov.usda.gov/nwcc/site?sitenum=793
The Nature Conservancy. “Economic Importance of the Colorado River.” Accessed August 7, 2022. https://www.nature.org/en-us/about-us/where-we-work/priority-landscapes/colorado-river/economic-importance-of-the-colorado-river/.
USGS Current Conditions for Colorado_ Streamflow. (n.d.). Retrieved August 5, 2022, from https://waterdata.usgs.gov/co/nwis/current/?type=flow&group_key=huc_cd
Water Education Foundation. “What’s an Acre-Foot?” Accessed August 5, 2022. https://www.watereducation.org/general-information/whats-acre-foot.
Water Resources. “Colorado River Basin Focus Area Study | U.S. Geological Survey.” USGS, October 16, 2018. https://www.usgs.gov/mission-areas/water-resources/science/colorado-river-basin-focus-area-study.